Download
1 / 12
120 likes | 327 Views
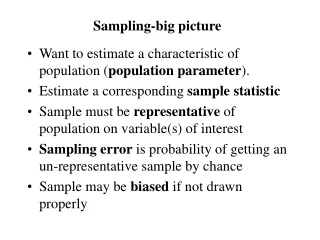
Sampling-big picture. Want to estimate a characteristic of population ( population parameter ). Estimate a corresponding sample statistic Sample must be representative of population on variable(s) of interest Sampling error is probability of getting an un-representative sample by chance

E N D
Sampling-big picture • Want to estimate a characteristic of population (population parameter). • Estimate a corresponding sample statistic • Sample must be representative of population on variable(s) of interest • Sampling error is probability of getting an un-representative sample by chance • Sample may be biased if not drawn properly
Sampling • Always define study population first • Use element/unit/extent/time for complete definition • element - who is interviewed • sampling unit - basic unit containing elements • extent - limit population (often spatially) • time - fix population in time
Adults 12 and older in vehicles entering Yogi Bear Park between July 1 and Aug 31, 1998 Teenagers (13-18) in households in Lansing, MI during May 1996 Exampleselement, unit, extent, time
Steps in Sampling • Define study population • Specify sampling frame and unit • Specify sampling method • Determine sample size • Specify sampling plan • Choose sample
Sampling methods • Probability vs non-probability (Doeseach element of population have known chance of being selected?) • Simple random sample or Systematic sample(equal probability) (choose every nth element) • Stratified vs Cluster Samplegroup elements and sample from groups • stratified: choose some from every group • cluster: only some groups sampled
Non-probability sampling • Convenience • Judgement • Purposive • Quota • Snowball
Prob or Non-prob Sample? • Project/generalize results to population - prob • Quantitative estimate of sampling error - prob • Accuracy needed & relative magnitude of sampling vs other kinds of errors • Homo- or hetero-geneous population • Overall Costs vs benefits
Stratify vs Cluster • Stratify to ensure enough samples from subgroups & to lower sampling error • Cluster primarily to reduce costs of gathering the data • Form homogeneous groups when stratifying, heterogeneous when clustering • Proportionate vs disproportionate sample • Stratification variables
Sample size • Based on four factors • Cost/budget • Accuracy desired • variance in popln on variable of interest • subgroup analysis planned • Formula: n= Z2 2 / e 2 • n= sample size • Z indicates confidence level (95% = 1.96) • = standard deviation of variable in population • e = sampling error
Sampling error formula n = Z2 2 / e 2 1. Solve for e to express error as a function of sample size, confidence level, and variance: e = (Z * ) / SQRT ( n ) 2. For binomial, = sqrt (p(1-p)) , where p is proportion for “yes” in the population Generate numbers in binomial sampling error table as: [1.96 *sqrt( p * (1-p)) ]/ sqrt (n)
Sampling errors for binomial(95% confidence interval)percent distribution in population
Computing 95% confidence interval • N= 100 , sample mean = 46%, use p= 50/50, • sampling error from table = 10% • 95% CI is 46% + or - 10% = (36, 56) • N=1,000 sample mean =22% • sampling error from table = 2.5% • 95% CI is 22% + or - 2.5% = (19.5, 24.5)