Download
1 / 15
150 likes | 290 Views
Drawing Curves. Lecture 9 Mon, Sep 15, 2003. Drawing Functions. If f(x) is a function, then thanks to the vertical-line test, for each value of x, there is at most one value of y on the graph of f(x).

E N D
Drawing Curves Lecture 9 Mon, Sep 15, 2003
Drawing Functions • If f(x) is a function, then thanks to the vertical-line test, for each value of x, there is at most one value of y on the graph of f(x). • Therefore, we may sample points along the x-axis, compute the y-coordinates on the curve, and then draw the graph.
Drawing Functions • For example, we may write the following. float dx = (xmax – mxin)/(numPts – 1); glBegin(GL_LINE_STRIP); for (float x = xmin; x <= xmax; x += dx); glVertex2f(x, f(x)); glEnd();
Drawing Functions • Is it better to compute f(x) in real time? • Or should we store the function values in an array? for (int i = 0; i < numPts; i++) { xcoord[i] = x; ycoord[i] = f(x); x += dx; } // Later glBegin(GL_LINE_STRIP); for (int i = 0; i < numPts; i++) glVertex2f(xcoord[i], ycoord[i]); glEnd();
Drawing Functions • What if we want to draw many functions? • If we choose to store them, how do we store them?
Drawing Functions • What if we wanted to draw a circle? • The circle fails the vertical line test. • We could draw two semicircles. • f1(x) = (r2 – x2) • f2(x) = -(r2 – x2) • Are there any problems with this? • Is there a better way?
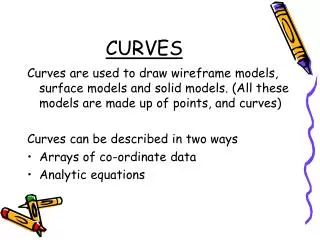
Curves in the Plane • We generally think of curves in the plane as being described by equations in x and y • Line: y = 3x + 5 • Parabola: y = 2x2 – 10 • Circle: x2 + y2 = 100 • Ellipse: x2 + 2y2 = 100 • However, it is often easier to describe curves parametrically.
Parametric Curves • To parameterize a curve, we define both x and y as functions of a parameter t. • x = x(t) • y = y(t) • The parameter t may be unrestricted or it may be restricted to some range a t b.
Parameterizing Lines • The line through two points A and B can be parameterized as • x(t) = A.x + (B.x – A.x)t • y(t) = A.y + (B.y – A.y)t • We may write this as in the vector form P = A + (B – A)t • What point do we get when • t = 0? t = 1? t = ½?
Line Segments and Rays • The linesegment AB is given by • x = A.x + (B.x – A.x)t • y = A.y + (B.y – A.y)t • 0 t 1 • The ray AB is given by the same, except • t 0 • What about the ray BA?
Parameterizing Circles and Arcs • The circle with center at C and radius r can be parameterized as • x(t) = C.x + r cos(t) • y(t) = C.y + r sin(t) • 0 t 2 • We get an arc if we restrict t further. • For example, suppose 0 t /2.
Parameterizing Ovals • To parameterize an oval (ellipse) with axis 2a in the x-direction and axis 2b in the y-direction, let • x(t) = a cos(t) • y(t) = b sin(t) • 0 t 2
Other Curves • Many interesting curves are possible. • What is the shape of the following curve? • x(t) = sin(t) • y(t) = sin(2t) • 0 t 2 • How about • x(t) = (t – 1)2 • y(t) = t(t – 2) • 0 t 2.
Parametric Curves in 3D • Three-dimensional curves are similar except there is also a z-coordinate given by z(t).
The Helix • A helix of radius 1 is given by • x(t) = cos(t) • y(t) = sin(t) • z(t) = t • 0 t 2