Download
1 / 19
190 likes | 348 Views
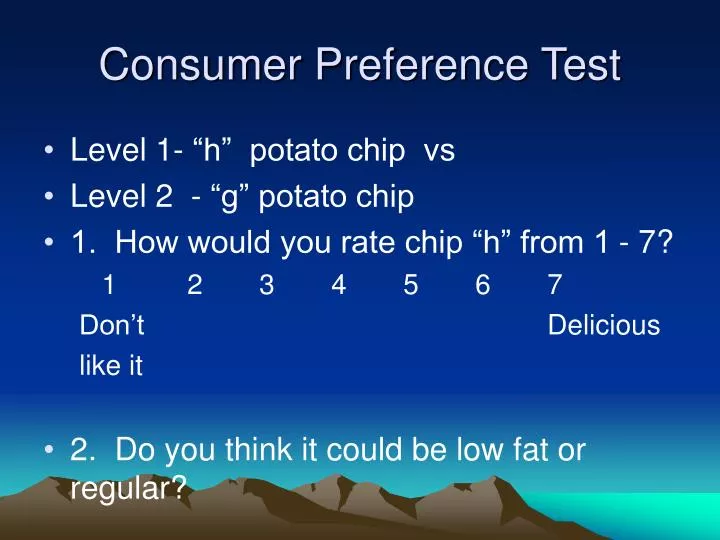
Consumer Preference Test. Level 1- “h” potato chip vs Level 2 - “g” potato chip 1. How would you rate chip “h” from 1 - 7? 1 2 3 4 5 6 7 Don’t Delicious like it 2. Do you think it could be low fat or regular? 1. How would you rate chip “g” from 1 - 7?

E N D
Consumer Preference Test • Level 1- “h” potato chip vs • Level 2 - “g” potato chip • 1. How would you rate chip “h” from 1 - 7? 1 2 3 4 5 6 7 Don’t Delicious like it • 2. Do you think it could be low fat or regular? • 1. How would you rate chip “g” from 1 - 7? • 1 Don’t like it 7 Delicious • 2. Is it low fat or regular?
Consumer Preference Test • ______________ Design • ________________ • Counterbalance means... • How to prevent Carryover effects?
Experimental Research • Researchers manipulate independent variable - 2 levels • And measure the other (dependent variable) • Give treatment to participants and observe if it causes changes in behavior • Compareexperimental group (w/ treatment) with a control group (no treatment) • Can say IV caused change in the DV
Experimental research design • Control extraneous variables • Hold constant • The only difference between experimental group and control group is the manipulated variable. • Treat groups equally except for treatment. • Randomize effects across treatments • Design to eliminate alternative explanations
Random Assignment • A way to assign participants in your sample to the various treatment conditions (groups that will receive different level of the IV) • Any member of your sample has equal chance of being assigned in any treatment group
Control Variable • The variable you want to keep constant in order to clarify the relationship between Dependent Variable and Independent Variable • “Confounding” variable (if not controlled)
Internal Validity • Ability of your research design to adequately test your hypothesis • Showing that variation in I.V. CAUSED the variation in the D.V. in experiment • In correlational study, • Showing that changes in value of criterion variable relate solely to changes in value of predictor variable
Example • Question: Does new teaching method work better than traditional method in intro psych course? • Method: Teaches class in morning using new method. • Teaches afternoon class using traditional method. • Both classes will use same book, tests, etc.
Findings • Results: Students exposed to new method have higher grades. • Concludes: New method better. • Justified? Why or why not?
Confounding • Whenever 2 or more variables combine in a way that their effects cannot be separated = confounding. • Thus, the teaching method study as designed lacks internal validity.
Dr. “Lee’s” study • Geography dept. had 10 Mac computers for their students to use • Anthro. dept. had 10 IBM-type pc computers. • Research question: How does the type of computer affect the quality of students’ papers? • Collected papers from each department’s student computer lab
Method: • Two graduate students in the English dept. rated the quality of the papers. • Results: the quality of the papers was higher in one department than in the other. • What can you conclude?
What are the independent variables in this study? • What are the dependent variables? • What variables are confounded with the independent variable? • Does this study have internal validity? Explain. • Does study have much external validity?
Threats to Internal Validity -- 7 Sources of Confounding • Campbell & Stanley (1963) • History • Other events occur that affect results • Maturation • Effect of age or fatigue • Testing
Threats to validity continued • Instrumentation • Changes in criteria used by observers or • instrument - (is scale set to 0?) • Statistical regression • If participants selected cause of extreme scores, will tend to be closer to average of pop. upon re-measure.
Threats to internal validity cont. • Biased selection of subjects • If participants differ in ways that affect their scores on DV • Experimental mortality • People drop out of study due to frustration, … those that remain differ than drop outs.
Within-Subjects/ Groups DesignRepeated measures • Each participant’s performance is measured under Treatment A • and again under Treatment B • Advantages reduce error from variation in participants • Disadvantages - attrition, carryover effects
Matched random assignment • When participant characteristics correlate w/ Dependent Variable • Assess the participants for the characteristics • Group participants w/ matching characteristics. • Matched sets of participants distributed at random, one per group. • Advantages Effect of error , • effect of characteristic distributed evenly across treatments.
Carryover effects • Previous treatment alters the behavior observed in subsequent treatment • Sources • learning • fatigue • habituation - repeated exposure -- reduced responsiveness • To effect - (breaks between treatments, change treatment order)