Download
1 / 15
150 likes | 266 Views
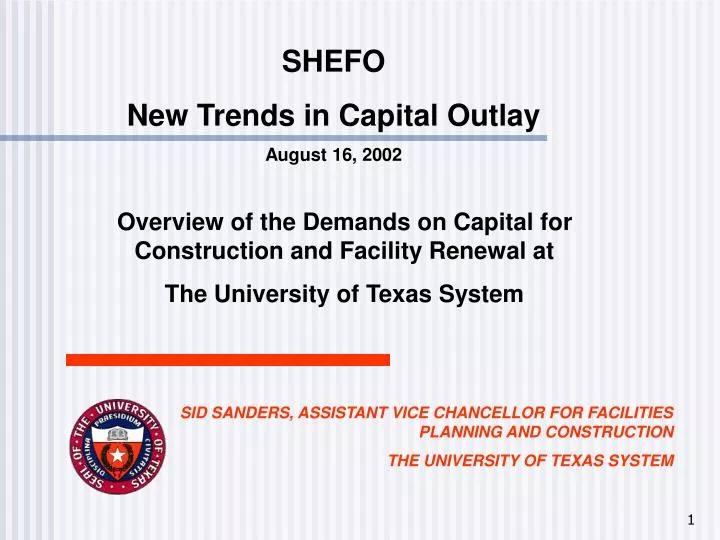
SID SANDERS, ASSISTANT VICE CHANCELLOR FOR FACILITIES PLANNING AND CONSTRUCTION THE UNIVERSITY OF TEXAS SYSTEM. SHEFO New Trends in Capital Outlay August 16, 2002. Overview of the Demands on Capital for Construction and Facility Renewal at The University of Texas System.

E N D
SID SANDERS, ASSISTANT VICE CHANCELLOR FOR FACILITIES PLANNING AND CONSTRUCTION THE UNIVERSITY OF TEXAS SYSTEM SHEFO New Trends in Capital Outlay August 16, 2002 Overview of the Demands on Capital for Construction and Facility Renewal at The University of Texas System
$7.02 Billion Annual Operation Budget • $2.35 Billion Academic Budget • 58 Million Square Feet of Facilities Space • 34.5 Million Square Feet of Academic Facilities • 160,000 Total Students • 150,000 Academic Students The University of Texas System Key Statistics • 9 Academic Institutions • 6 Health Institutions
The University of Texas System System Map
The University of Texas System Current Facility Conditions Total Construction in 5-Year Cohorts
The University of Texas System Current Facility Conditions Estimated Renewal Requirements Average Annual Average Annual Average Annual Annual Total Campus Total Bldg. Renewal E&G Bldg. Renewal Infra. Renewal Building (millions) (millions) (millions) Renewal/CRV Arlington $ 13.1 $ 11.0 $ 2.5 1.7% Austin $ 57.3 $ 42.1 $ 12.7 1.7% Brownsville $ 3.3 $ 1.1 $ 1.0 1.5% Dallas $ 5.4 $ 4.6 $ 1.7 1.7% El Paso $ 10.8 $ 7.1 $ 2.2 1.7% Pan American $ 6.8 $ 5.7 $ 1.1 1.7% Permian Basin $ 1.8 $ 1.1 $ 0.8 1.7% San Antonio $ 6.8 $ 5.8 $ 2.1 1.6% Tyler $ 1.4 $ 1.3 $ 0.5 1.5% System $ 1.1 $ 0.9 $ 0.0 1.8% subtotal $107.8 $ 80.7 $ 24.6 1.7% SMC Dallas $ 25.1 $ 12.1 $ 2.8 1.7% MB Galveston $ 29.8 $ 13.7 $ 3.6 1.8% HSC Houston $ 15.1 $ 13.3 $ 0.2 2.0% HSC San Antonio $ 11.9 $ 11.5 $ 1.1 1.8% MD Anderson $ 25.7 $ 6.2 $ 1.7 1.9% HC Tyler $ 3.3 $ 0.9 $ 0.6 1.6% subtotal $110.9 $ 57.7 $ 10.0 1.8% TOTAL $218.7 $ 138.4 $ 34.6 1.7%
The University of Texas System Current Facility Conditions Projected vs. Actual Capital Renewal Spending Average Annual Average Annual Campus Total Building Renewal E&G Building Renewal (Millions) (Millions) Projected Actual Projected Actual Academic $107.8 $48.1 $80.7 $40.6 Health $110.9 $59.1N/A N/A Actual capital renewal spending has been running $40 million below projected amount to maintain existing facilities.
The University of Texas System Current Facility Conditions Long-Term Renewal Curves
The University of Texas System Demand for New Construction Partial List of UT System Goals for 2030* • Grow enrollment by 87,000 from 150,000 to 237,000 by 2030 • Develop centers of excellence with added doctoral programs, expanded research, and serve a more selective group of students • Ensure that UT Austin becomes one of the Top Five public universities in the nation • Ensure that development of one additional nationally ranked institution of first choice by 2010, another by 2020, and one more by 2030 *From Service to Texas in the New Century, January 2001
The University of Texas System Demand for New Construction Capital Impact of Enrollment Growth Goal • 87,000 new students by 2030 • Currently UT System has 160 square feet per student of E&G facilities. This is the mean for all Higher Education in the state. • By 2030 this ratio will require 14,000,000 gross square feet of new E&G facilities • Equivalent of building another UT Austin
Based on inventories of UT Arlington, UT Dallas, and UT San Antonio Office/Admin = 38.6% Average of Total E&G Space Classroom = 34.4% Average of Total E&G Space Dry Lab = 15.7% Average of Total E&G Space Wet Lab = 11.3% Average of Total E&G Space Total Estimated Project Cost 14 MGSF x 0.386 x $210/GSF = $1.13 Billion for Office/Admin Space 14 MGSF x 0.344 x $225/GSF = $1.08 Billion for Classroom Space 14 MGSF x 0.157 x $260/GSF = $0.57 Billion for Dry Lab Space 14 MGSF x 0.113 x $350/GSF = $0.55 Billion for Wet Lab Space The University of Texas System Demand for New Construction Total Estimated Project Cost = $3.33 Billion for 14 MGSF
The University of Texas System Capital Improvement Program Funding Sources Total CIP: $ 3,727.4 Million 12% 18% 15% 29% 26% State support for capital construction has averaged just over 12% for the last eight years. Note: Totals in millions of dollars
Unfunded Capital Renewal of Existing $1.12 Billion Academic E&G Facilities (40 million/year for 28 years) • New Supporting Campus Infrastructure $ .67 Billion (Estimated at 20% of Aggregate New Facility Cost) The University of Texas System Demand for New Capital Aggregate Capital Needs through 2030 (in 2002 dollars) • New Academic E&G Facilities for Expanded Enrollment $3.33 Billion TOTAL $5.12 Billion
High Potential Sources of New Capital • Gifts and Grants • Bonding Against Increases in Designated Tuition • Bonding Against Increases in Research Revenues • Bonding Against Self-Generating Revenues of Auxiliary Enterprises Limited Potential Sources of New Capital • Direct State Funding • Bonding Against Current Tuition • Bonding Against Income from Endowment The University of Texas System Demand for New Capital
The University of Texas System Conclusions • UT System is facing a period of aging facilities and substantial population growth that will require billions of dollars in new capital to support. • State support has been static and is projected to remain so. • To meet these substantial pressures, UT System will increasingly need to look at alternative sources of capital. • Private gifts and grants • Increased tuition • Increased research revenues • Increased designated fees • Increased auxiliary revenues
SHEFO New Trends in Capital Outlay Questions? www.utsystem.edu/fpc