Download
1 / 30
300 likes | 308 Views
Explore the untapped potential of renewable energy sources such as hydroelectricity and wind energy. Learn about their benefits, the renewable energy consumption landscape, and the challenges faced in harnessing their full potential.

E N D
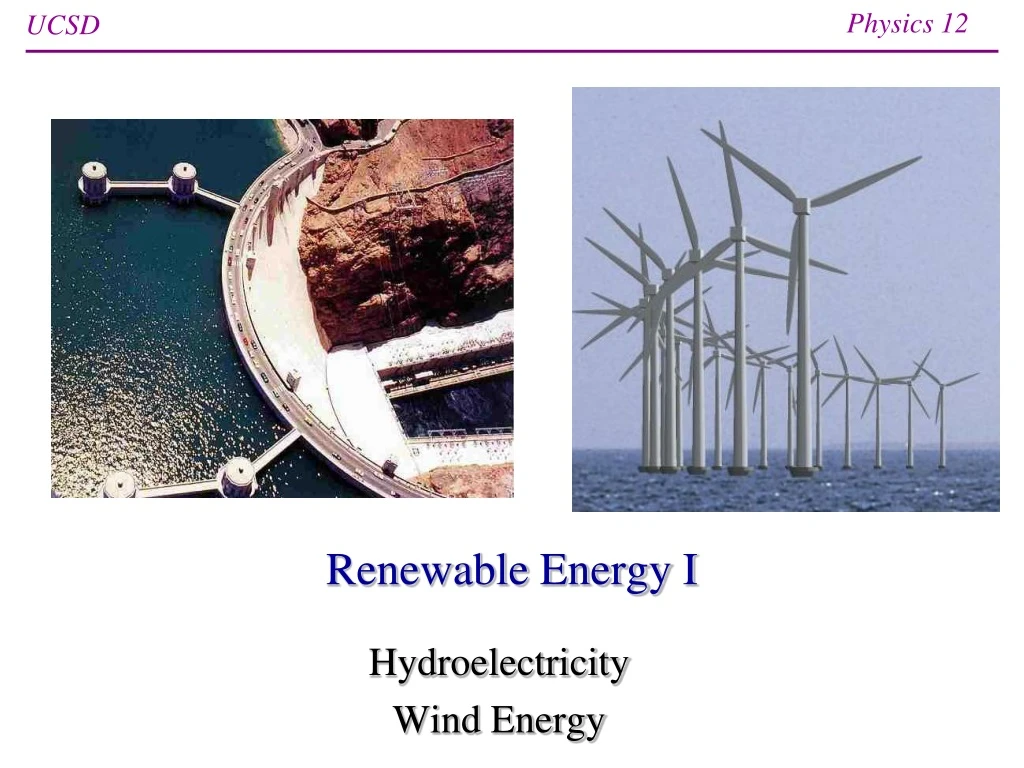
Renewable Energy I Hydroelectricity Wind Energy
Renewable Resources • Renewable means anything that won’t be depleted by using it • sunlight (the sun will rise again tomorrow) • biomass (grows again) • hydrological cycle (will rain again) • wind (sunlight on earth makes more) • ocean currents (driven by sun) • tidal motion (moon keeps on producing it) • geothermal (heat sources inside earth not used up fast)
Renewable Energy Consumption much room for improvement/growth, but went backwards from 1994 to 2003! Slide copied from Lecture 11
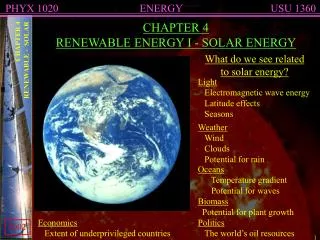
Another look at available energy flow • The flow of radiation (solar and thermal) was covered in Lecture 11 • earth is in an energy balance: energy in = energy out • 30% reflected, 70% thermally re-radiated • Some of the incident energy is absorbed, but what exactly does this do? • much goes into heating the air/land • much goes into driving weather (rain, wind) • some goes into ocean currents • some goes into photosynthesis
Outstanding Points from Fig. 5.1 • Incident radiation is 1741015 W • this is 1370 W/m2 times area facing sun (R2) • 30% directly reflected back to space • off clouds, air, land • 47% goes into heating air, land, water • 23% goes into evaporating water, precipitation, etc. (part of weather) • Adds to 100%, so we’re done • but wait! there’s more…
Energy Flow, continued • 0.21% goes into wind, waves, convection, currents • note this is 100 times less than driving the water cycle • but this is the “other” aspect of weather • 0.023% is stored as chemical energy in plants via photosynthesis • total is 401012 W; half in ocean (plankton) • humans are 7 billion times 100 W = 0.71012 W • this is 1.7% of bio-energy; 0.0004% of incident power • All of this (bio-activity, wind, weather, etc.) ends up creating heat and re-radiating to space • except some small amount of storage in fossil fuels Q2
The Hydrologic Cycle Lots of energy associated with evaporation: both mgh (4% for 10 km lift) and latent heat (96%) of water
Energetics of the hydrologic cycle • It takes energy to evaporate water: 2,250 J per gram • this is why “swamp coolers” work: evaporation pulls heat out of environment, making it feel cooler • 23% of sun’s incident energy goes into evaporation • By contrast, raising one gram of water to the top of the troposphere (10,000 m, or 33,000 ft) takes mgh = (0.001 kg)(10 m/s2)(10,000 m) = 100 J • So > 96% of the energy associated with forming clouds is the evaporation; < 4% in lifting against gravity
Let it Rain • When water condenses in clouds, it re-releases this “latent heat” • but this is re-radiated and is of no consequence to hydro-power • When it rains, the gravitational potential energy is released, mostly as kinetic energy and ultimately heat • Some tiny bit of gravitational potential energy remains, IF the rain falls on terrain (e.g., higher than sea level where it originated) • hydroelectric plants use this tiny left-over energy: it’s the energy that drives the flow of streams and rivers • damming up a river concentrates the potential energy in one location for easy exploitation
How much of the process do we get to keep? • According to Figure 5.1, 401015 W of solar power goes into evaporation • this corresponds to 1.61010 kg per second of evaporated water! • this is 3.5 mm per day off the ocean surface (replenished by rain) • The gravitational potential energy given to water vapor (mostly in clouds) in the atmosphere (per second) is then: mgh = (1.61010 kg)(10 m/s2)(2000 m) = 3.21014 J • One can calculate that we gain access to only 2.5% of the total amount (and use only 1.25%) • based on the 1.8% land area of the U.S. and the maximum potential of 147.7 GW as presented in Table 5.2
Power of a hydroelectric dam • Most impressive is Grand Coulee, in Washington, on Columbia River • 350 feet = 107 m of “head” • > 6,000 m3/s flow rate! (Pacific Northwest gets rain!) • each cubic meter of water (1000 kg) has potential energy: mgh = (1000 kg)(10 m/s2)(110 m) = 1.1 MJ • At 6,000 m3/s, get over 6 GW of power • Large nuclear plants are usually 1–2 GW • 11 other dams in U.S. in 1–2 GW range • 74 GW total hydroelectric capacity, presently Q2
Hydroelectricity in the future? • We’re almost tapped-out: • 50% of potential is developed • remaining potential in large number of small-scale units • Problems with dams: • silt limits lifetime to 50–200 years, after which dam is useless and in fact a potential disaster and nagging maintenance site • habitat loss for fish (salmon!), etc.; wrecks otherwise stunning landscapes (Glenn Canyon in UT) • Disasters waiting to happen: 1680 deaths in U.S. alone from 1918–1958; often upstream from major population centers Q
Sorry: try again… • So hydroelectricity is a nice “freebee” handed to us by nature, but it’s not enough to cover our appetite for energy • Though very efficient and seemingly environmentally friendly, dams do have their problems • This isn’t the answer to all our energy problems, though it is likely to maintain a role well into our future
The Power of Wind • We’ve talked about the kinetic energy in wind before: • a wind traveling at speed v covers v meters every second (if v is expressed in m/s) • the kinetic energy hitting a square meter is then the kinetic energy the mass of air defined by a rectangular tube • tube is one square meter by v meters, or v m3 • density of air is = 1.3 kg/m3 at sea level (and 0°C) • mass is v kg • K.E. = ½(v)·v2 = ½v3 (per square meter) • 0.65v3 at sea level
Wind Energy proportional to cube of velocity • The book (p. 134) says power per square meter is 0.61v3, which is a more-or-less identical result • accounts for above sea level and more typical temps. • If the wind speed doubles, the power available in the wind increases by 23 = 222 = 8 times • A wind of 10 m/s (22 mph) has a power density of 610 W/m2 • A wind of 20 m/s (44 mph) has a power density of 4,880 W/m2 Q
Can’t get it all • A windmill can’t extract all of the kinetic energy available in the wind, because this would mean stopping the wind entirely • Stopped wind would divert oncoming wind around it, and the windmill would stop spinning • On the other hand, if you don’t slow the wind down much at all, you won’t get much energy • Theoretical maximum performance is 59% of energy extracted • corresponds to reducing velocity by 36%
Practical Efficiencies • Modern windmills attain maybe 50–70% of the theoretical maximum • 0.5–0.7 times 0.59 is 0.30–0.41, or about 30–40% • this figure is the mechanical energy extracted from the wind • Conversion from mechanical to electrical is 90% efficient • 0.9 times 0.30–0.41 is 27–37%
Typical Windmills • A typical windmill might be 15 m in diameter • 176 m2 • At 10 m/s wind, 40% efficiency, this delivers about 40 kW of power • this would be 320 kW at 20 m/s • typical windmills are rated at 50 to 600 kW • How much energy per year? • 10 m/s 610 W/m2 40% 240 W/m2 8760 hours per year 2,000 kWh per year per square meter • but wind is intermittent: real range from 100–500 kWh/m2 • corresponds to 11–57 W/m2 average available power density • Note the really high tip speeds: bird killers • but nowhere near as threatening as cars and domestic cats!
Average available wind power recall that average solar insolation is about 150–250 W/m2
Comparable to solar? • These numbers are similar to solar, if not a little bigger! • Let’s go to wind! • BUT: the “per square meter” is not land area—it’s rotor area • Doesn’t pay to space windmills too closely—one robs the other • Typical arrangements have rotors 10 diameters apart in direction of prevailing wind, 5 diameters apart in the cross-wind direction • works out to 1.6% “fill factor” 10 diameters 5 diameters wind rotor diameter Q
Current implementations • Rapidly developing resource • 1.4 GW in 1989; 6.4 GW in 2003; 60 GW by end of 2012 • fast-growing (about 25% per year) • cost (at 5–7¢ per kWh) is competitive • expect to triple over next ten years • Current capacity: ~60 GW • but should only count as 15 GW of continuous
http://www.windpoweringamerica.gov/wind_installed_capacity.asphttp://www.windpoweringamerica.gov/wind_installed_capacity.asp Texas overtook California in 2007; Iowa coming up fast
Flies in the Ointment • Find that only 25% of rated capacity is achieved • design for high wind, but seldom get it • 3% of electrical supply in U.S. is now wind • total electrical capacity in U.S. is 1051 GW; average supply 451 GW • limited tolerance on grid for intermittent sources • lore says 20%, but could be substantially higher in nationwide grid • If fully developed, we could generate an average power almost equal to our current electrical capacity (764 GW) • but estimates vary widely • some compute < 2000 GW practically available worldwide • and struggle to deal with intermittency hits at some point Q
An Aside: Capacity vs. Delivered (2011) • N.G. plants often used as “peaker” plants when demand is high • Nuclear plants basically just ON • Use oil for electricity only when necessary • Wind and solar effectively 5 hours/day
Announcements/Assignments • Read Chapter 5, sections 1, 2, 3, 5, 7 • Optional reading at Do the Math: • 27. How Much Dam Energy Can We Get? • 25. Wind Fights Solar; Triangle Wins • HW 5 & Quiz due Friday