Download
1 / 23
230 likes | 400 Views
PM10 forecasting with OVL-RIO. Peter Viaene, Stijn Janssen - VITO Edward Roekens – VMM Frans Fierens – IRCEL GlobAerosol User Workshop November 29, 2007. Outline. Introduction: need for operational forecasting of PM10 OVL-RIO OVL: forecast model RIO: interpolation model Shortcomings

E N D
PM10 forecastingwith OVL-RIO Peter Viaene, Stijn Janssen - VITO Edward Roekens – VMM Frans Fierens – IRCEL GlobAerosol User Workshop November 29, 2007
Outline • Introduction: need for operational forecasting of PM10 • OVL-RIO • OVL: forecast model • RIO: interpolation model • Shortcomings • COPS and use of AOD maps for OVL-RIO • What is COPS? • application with AOD from MERIS observations • Conclusions and our GlobAerosol wishlist
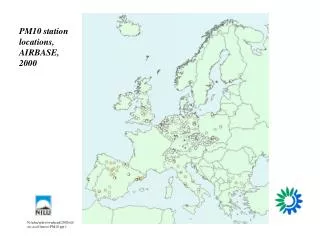
1. Introduction Introduction • in Belgium air quality assessment is responsibility of IRCEL and VMM (www.irceline.be / www.vmm.be) • Decisions PM10 are based on: • Real-time data: 43 stations • Forecasts: MODEL
Introduction Application: forecast at IRCEL of 24-h averaged PM10 > 70 µg/m³ is first “trigger” in decision chain for imposing speed limitations on motorway in Flanders
OVL-RIO OVL-RIO = OVL + RIO • OVL forecast station (point) values for day+1,… day+4 • RIO spatial interpolation of measured and predicted point values
2. Objective OVL - Objective • Every day at 8:30 make a forecast of day average PM10 for today, day+1, …, day+4 • If forecast exceeds threshold: action / communication plan - Calculations should be fast - Emphasis on high PM10 concentrations
OVL - Methodology Available information Fast, operational Forecast 3. Method • PM10 in-site measurements • Meteo forecast (ECMWF) Input: Neural Network Process: day average PM10 of day 0, day+1,…, day+4 Target:
OVL - Results • Real-time communication (on-line www.irceline.be) • Validation (off-line)
RIO - Introduction ? • Measurements and forecasts are available at point locations • Communication to general public: clear need for a map! • How to produce a reliable air quality map from point values? • Interpolation model
RIO - Methodology detrended Kriging interpolation model procedure: • detrending: remove the local character to obtain spatial homogeneity as required by kriging • apply standard kriging • ‘re-trending’: reintroduce the local bias de- and retrending are done using the relationship of the air quality observation with an indicator for which we know the spatial pattern
RIO - Methodology • Observation: • Sampling values depend on land use in (direct) vicinity of the monitoring site • Approach in RIO-model: • Create land use indicator (β)to express relation based on CORINE landcover map
RIO - Methodology Use relation between land use indicator and air quality statistics to “detrend” monitoring data
RIO - Methodology For each grid cell: • Interpolate detrended values with Kriging • Determine local land use indicator • Get corresponding trend shift • Add trend to interpolation result
RIO - Results Year average PM10 concentrations for 2005 IDW RIO
RIO - Shortcoming • RIO can be applied for PM10 but… a reliable spatial pattern of PM10 is required! • Difficult to define spatial pattern for PM10 based on CORINE Land Cover • Sources of PM10 emission are very erratic: • Traffic • Industry • Domestic heating • Agriculture • Natural sources (sea salt, wind blown dust, pollen,…) • …
COPS project • ESA project “Cooperating EO Sensors” • goal: “Combining earth observation and in-situ measurements in a generic and interoperable way to improve existing applications” • COPS applications integrated as services in ESA’s SSE (Service Support Environment) technology! • OVL-RIO application: combine in-situ measurements of PM10 with AOD maps based on earth observation to produce PM10 maps
OVL – RIO for COPS AOD (raw data) - C360 (all available data) - 1km de / re trending with AOD maps based on MERIS L2 RR data
OVL – RIO for COPS: RESULTS PM10 concentration map for 13-09-2007 • results are currently being validated • look fine but some questions on MERIS AOD quality…
OVL – RIO and GlobAerosol poor correlation with map based on MERIS summer time AOD observations
OVL – RIO and GlobAerosol timeseries for 3 points in Brussels • many missing values above cities • spatial difference in time of gaps in data number of observations (white = low)
OVL – RIO and GlobAerosol COMPARISON with MODIS (MOD04 product) MODIS MERIS
OVL – RIO and GlobAerosol • Project will probably continue : interested in other sources of AOD maps • Requirements for AOD data in OVL – RIO: • Spatial resolution of ± 5 km (or less) which is the current resolution of the OVL-RIO application at IRCEL • Annual, seasonal or monthly composites
CONCLUSIONS • OVL-RIO combines a forecasting model (OVL) with a spatial interpolation tool (RIO) to produce maps of PM10 • for PM10 the interpolation procedure can use an AOD map to detrend the point values • the results using MERIS RR based observations look promising but we would like to use other data as well