Download
1 / 42
420 likes | 551 Views
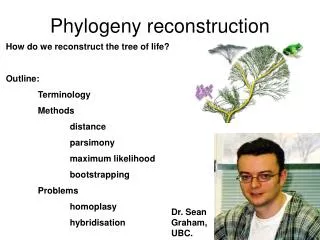
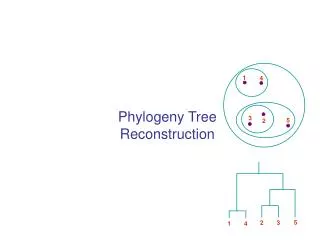
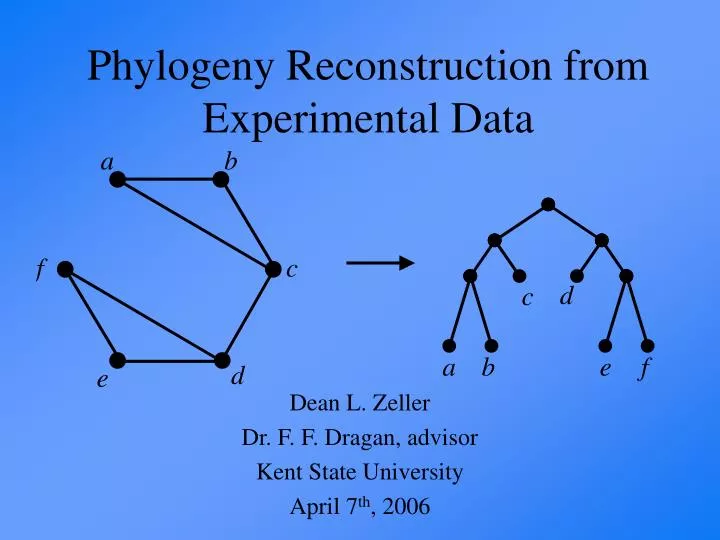
Phylogeny Reconstruction from Experimental Data. Dean L. Zeller Dr. F. F. Dragan, advisor Kent State University April 7 th , 2006.

E N D
Phylogeny Reconstruction from Experimental Data Dean L. Zeller Dr. F. F. Dragan, advisor Kent State University April 7th, 2006
“…the great Tree of Life fills with its dead and broken branches the crust of the earth, and covers the surface with its ever-branching and beautiful ramifications.” Charles Darwin (1809-1882) Father of Evolution Phylogeny Reconstruction
Outline • Goals of research • Evolution trees, phylogenies • Assumptions • Atlas of Evolution Trees • Genetic tests (hypothetical) • Phylogeny reconstruction methods • Future Work Phylogeny Reconstruction
Goals of Research Specific Goals • Create methods of phylogeny reconstruction from various hypothetical tests. • Make use of and create more adequate evolution models. • Create “teachable” lessons on bioinformatics suitable for a mid-level computer science, mathematics, or biology class. Long Term Goals • Discover methods of phylogeny reconstruction from a new perspective. • Educate the next generation of computational biologists. Phylogeny Reconstruction
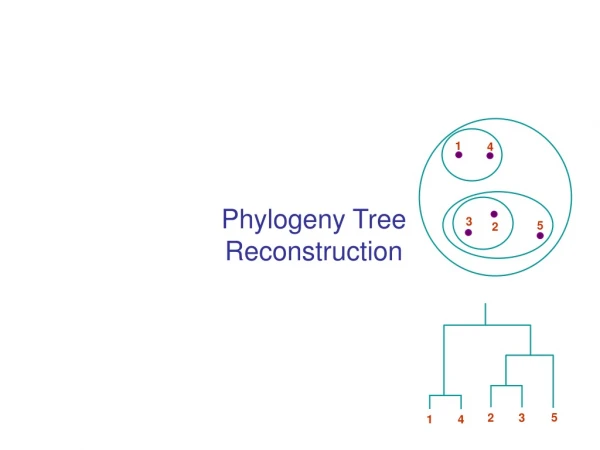
Evolution Tree example Phylogeny Reconstruction
Evolution Tree example Phylogeny Reconstruction
Evolution Tree (theoretical) Phylogeny Reconstruction
Assumptions • By making simple assumptions, the problem complexity is greatly reduced. • Redundant nodes removed • Multiple splits nodes replaced with isomorphic approximations • Only consider isomorphically unique trees Phylogeny Reconstruction
Assumption #1 • Redundant nodes are removed without loss of data. • It is already assumed the species is slowly changing over time. It does not add to the problem to consider a single point along the way. Phylogeny Reconstruction
Assumption #2 • Multiple split nodes replaced with isomorphic approximations • Some loss of data, but greatly reduces the problem complexity Phylogeny Reconstruction
Assumption #3 • Isomorphically unique trees Phylogeny Reconstruction
Atlas of Evolution Trees (5 leaves) Phylogeny Reconstruction
Atlas of Evolution Trees (6 leaves) Phylogeny Reconstruction
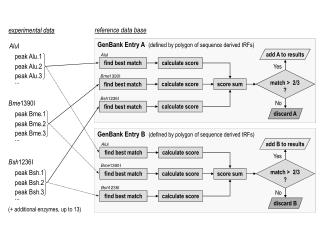
Genetic Tests • At this point, all tests are purely hypothetical. • Plausible results can be converted from existing tests. • Binary Two-Species Test (BTST) • Discrete Two-Species Test (DTST) • Continuous Two-Species Test (CTST) • Closer Relative Three-Species Test (CRTST) Phylogeny Reconstruction
Binary Two-Species Test (BTST) • Returns 1 if species x and y are genetically close to a certain degree, and 0 otherwise. • Data collected to form a similarity grid and distance graph (k-leaf root). Phylogeny Reconstruction
Step 1 – Difference Summary Table a b c d e f a 1 1 0 0 0 b 1 0 0 0 c 1 0 0 d 1 1 e 1 f Reconstruction from BTST Step 2 – k-leaf root Step 3 – phylogeny Phylogeny Reconstruction
Reconstruction from BTST • Linear time solution exists for k = 3 [Br05a] • … and k = 4 [Br05b] • An open problem for k 5 • Severely limits analysis capability. Phylogeny Reconstruction
Discrete Two-Species Test (DTST) • Returns a discrete value (k=2,3,4,…) denoting distance between x and y in tree. • Test can be converted from existing tests. • Data collected to form a distance grid. • Create distance graphs incrementally. Phylogeny Reconstruction
Difference Summary Table a b c d e f a 2 3 5 6 6 b 3 5 6 6 c 4 5 5 d 3 3 e 2 f Reconstruction from DTST k 3 k 2 k 4 k 5 k 6 Phylogeny Reconstruction
Reconstruction from DTST Distance 2 Direct Neighbors Distance 3 Close relatives Distance 4 Tree complete Phylogeny Reconstruction
Continuous Two Species Test (CTST) • Returns a continuous value d denoting distance between x and y in tree. • Data collected to form a distance grid. • Tree reconstructed in ascending order of closeness. • Highest degree of accuracy required Phylogeny Reconstruction
Distance Summary Table a b c d e f a 1.96 3.64 7.31 9.07 11.65 b 3.51 7.64 12.34 10.71 c 5.90 8.21 7.99 d 4.73 4.63 e 2.31 f Reconstruction from CTST Phylogeny Reconstruction
Reconstruction from CTST Diff(a,b) 1.96 Make connection Diff(e,f) 2.31 Make connection Diff(b,c) 3.51 Make connection Diff(a,c) 3.64Connection previously established Diff(d,f) 4.63 Make connection Diff(d,e) 4.73Connection previously established Diff(c,d) 5.90 Make connection , STOP -- All species included in tree Phylogeny Reconstruction
Actual CTST data Source: [Fe04] Phylogeny Reconstruction
Phylogeny Reconstruction Reconstruction from CTST results in the following tree: Phylogeny Reconstruction
CTST Results, part 1 • Use the correlation statistical measurement to determine relationship between data used to create tree and distance data created by tree. (>0.8 is “strong”.) data distance chimp human 0.27 2 gorilla human 0.31 3 gorilla chimp 0.35 3 orang gorilla 0.46 3 orang human 0.47 4 orang chimp 0.51 4 gorilla human 0.56 5 gibbon gorilla 0.60 5 gibbon chimp 0.62 5 gibbon orang 0.71 3 Correlation: 0.64 (positive relationship exists) Note: if gibbon orang was 5 instead of 3, the correlation would be 0.93. Phylogeny Reconstruction
CTST Results, part 2 • Use the correlation statistical measurement to determine relationship between remaining data and distance data created by tree. data distance mouse chimp 1.44 6 mouse gorilla 1.45 5 mouse human 1.46 6 mouse orang 1.48 4 mouse gibbon 1.52 3 bovine gorilla 1.52 6 bovine human 1.59 7 bovine chimp 1.60 7 bovine orang 1.66 5 bovine mouse 1.67 3 bovine gibbon 1.72 4 Correlation: -.24 (weak negative relationship) Phylogeny Reconstruction
CTST Conclusions • Relationship is statistically significant for the lower data values resulting in species close on resulting phylogeny, but is weak for data values further away. • There are stronger methods of phylogeny reconstruction, but this serves as a good starting point. Phylogeny Reconstruction
Closer Relative Three-Species Test (CRTST) • Returns one of two possible trees on three species. • Use the Merge Partial Evolution Trees [Li99] algorithm to reconstruct phylogeny. • Allows for multiple species evolution. Phylogeny Reconstruction
Results from CRTST data Phylogeny Reconstruction
Reconstruction from CRTST Phylogeny Reconstruction
Reconstruction from CRTST Phylogeny Reconstruction
Reconstruction from CRTST Phylogeny Reconstruction
Reconstruction from CRTST Phylogeny Reconstruction
Literature Review of Related Methods • Additive and Ultrametric Trees [Wu04] • Minimum Increment Evolution Tree (MEIT) [Wu04] • Evolutionary Tree Insertion with Minimum Increment (ETIMI) [Wu04] • Maximum Homeomorphic Agreement Subtree (MHT) [Ga97] • Maximum Agreement Subtree (MAST) [Ga97] • Maximum Inferred Consensus Tree (MICT) [Li99] • Maximum Inferred Local Consensus Tree (MILCT) [Li99] • Balanced Randomized Tree Splitting (BRTS) [Ka99] • Merging Partial Evolution Trees (MPET) [Li99] Phylogeny Reconstruction
Atlas of Distance Graphs • Inspired by An Atlas of Graphs[Re99] • Elegant yet simple way to analyze graphs and trees • Apply same style to phylogenies and distance graphs. Phylogeny Reconstruction
Atlas of Distance Graphs k=2 k=2 k=3 k=2 k=3 k=4 Phylogeny Reconstruction
Atlas of Distance Graphs k=2 k=3 k=4 k=2 k=3 k=4 k=5 Phylogeny Reconstruction
k = 2 k = 3 k = 4 k = 5 k = 6 k = 7 k = 8 Distance Graph Simulator a b i h c d g e f Graph complete Phylogeny Reconstruction
Class Assignments • Assignment 1 – Drawing Trees • Assignment 2 – Phylogenetic Distance Graphs • Assignment 3 – Phylogeny Reconstruction (Tested on CS10051 students, Spring 2006) Phylogeny Reconstruction
Future Work • Additional bioinformatics class assignments • Atlas of Phylogenetic Distance Graphs • Implement the Phylogeny Reconstruction Simulator using NetworkX • Remove redundant node and isomorphic approximation assumptions • Apply to all nodes in tree instead of just the leaves Phylogeny Reconstruction
References [Br05a] Brandstädt, A., V.B. Le, and R. Sritharan (2005). “Structure and Linear Time Recognition of 4-Leaf Powers”, Unpublished manuscript. [Br05b] Brandstädt, A. and V. B. Le (2005). “Structure and Linear Time Recognition of 3-Leaf Powers”, Unpublished manuscript. [Fe04] J. Felsenstein (2004). Inferring Phylogenies, Sinauer Associates, Inc. [Ga97] L. Gąsieniec, J. Jansson, A. Lingas, and A. Östlin (1997), “On the complexity of computing evolutionary trees,” Proceedings of Computing and Combinatonics Third Annual International Conference COCOON ’97, Shanghai, China, pp. 134 to 145, Aug 97. [Ka99] Y. Kao, A. Lingas, and A. Östlin (1999), “Balanced Randomized Tree Splitting with Applications to Evolutionary Tree Constructions,” Proceedings of the 16th Annual Symposium on Theoretical Aspects of Computer Science, Trier, Germany, pp. 184 to 196, March 1999. [Li99] A. Lingas, H. Olsson, and A. Östlin (1999), “Efficient Merging, Construction, and Maintenance of Evolutionary Trees,” Proceedings of the 26th International Colloquium on Automata, Languages, and Programming (ICALP) ’99, Prague, Chech Republic, pp. 544 to 553, July 1999. [Re99] Read, R.C. and R.J. Wilson (1999). An Atlas of Graphs, Oxford Science Publications. [Wu04] Wu, B.Y. and K.M. Chao (2004). Spanning Trees and Optimization Problems. Chapman & Hall/CRC. Phylogeny Reconstruction