Download
1 / 20
200 likes | 214 Views
This presentation compares two Bus Rapid Transit (BRT) operating plans for East Bay - Separate BRT and All-in-One BRT, evaluating factors like transit travel time, ridership, energy use, cost, and impacts on traffic. Helpful insights for the Policy Steering Committee's future decisions.

E N D
East Bay Bus Rapid Transit presented toPolicy Steering Committee presented byAC Transit May 15, 2009
Purpose • Understand two BRT operating plans considered in DEIS/DEIR • Explain reasoning for staff-preferred operating plan • Provide information to PSC members for future decision 2
Two BRT Operating Scenarios 1) Separate BRT and Local Services • Two separate bus services in corridor • BRT in bus-only lanes with wide station spacing • 35 stations, average ½ mile (6 blocks) • Local service in mixed-flow traffic with narrow stop spacing • 105 stops, average 900 feet (2 blocks) 2) All-in-One (Combined BRT and Local Services) • A single bus service in the corridor • All buses in bus-only lanes • Intermediate station spacing • 49 stations, average 1/3rd mile (4 blocks) 3
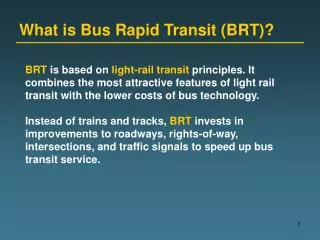
Key Issues for Comparison • Transit travel time • Transit ridership • Auto travel • Energy and greenhouse gases • Capital cost • Operating cost • Bicycle environment • Traffic impact • Parking impact • Walk access 4
Comparison Summary Separate BRT and Local All-in-One Average Transit Travel Time + Transit Ridership + Auto Travel + Energy, Greenhouse Gases + Capital Cost + Operating Cost + Bicycle Environment + Traffic Impacts + Parking Impacts similar + Walk Access 5
Effect on Travel Time*Downtown Berkeley to Bay Fair BART • “Separate” has fast BRT and a slow local bus • BRT: 59 minute • Local: 109 min • Average: 76 min • “All-in-One” on average faster than Separate • BRT: 66 min * Year 2025, PM peak 6
Transit RidershipYear 2025 Separate BRT and Local All-in-One No-Build Corridor Transit Boardings 28,100 43,700 49,200 New Transit Trips* 9,300 5,300 * Increase over No-Build 7
Auto TravelYear 2025 Separate BRT and Local All-in-One Reduction in Daily Auto Trips 5,300 9,300 Reduction in Daily Auto VMT* 11,800 20,700 * Vehicle Miles Travelled 8
Energy and Greenhouse GasesYear 2025 Separate BRT and Local All-in-One Reduction in Annual Energy Usage 210,000 gallons* 50,000 gallons* Reduction in Annual GHGs 1,900 tons** 120 tons** * Annual Gasoline and gasoline equivalents ** Annual CO2 and CO2 equivalents 9
Capital and Operating CostService Frequency (Weekday, Minutes Between Buses) Peak Midday Evening Owl Existing 1R 12 12 1 15 20 20 60 Separate BRT and Local BRT 7.5 7.5 20 1 15 15 20 60 All-in-One BRT 5 5 10 60 10
Capital and Operating Cost$ millions Separate BRT and Local All-in-One No-Build Capital Cost $215 $235 $21.5 Annual Operating Cost* $25.6 $26.9 $15.0 Annual Operating Cost Net of Fare Revenue* $15.4 $18.2 * Estimate for year 2025 costs in 2008 dollars. 11
Bicycle Environment • All-in-One provides better bicycle environment • Lower auto VMT • All buses operate in median bus lanes • No interference between buses and bicycles 12
Traffic Impacts • All-in-One has less impact on traffic • Lower auto VMT • All buses operate in median bus lanes • No interference between buses and autos 13
Parking Impacts • Two scenarios roughly equal • “Separate” requires both BRT Stations and Local Stops between Stations • Parking Loss at Stations • Parking restrictions remain in place at local bus stops • “All-in-One” has two effects on parking • More parking loss due to more BRT stations • Some parking spaces recovered at former local bus stops 14
Effect on Walk Distance • Some local bus stops removed with All-in-One • 80% of riders unaffected • They walk to the same station as today • 20% of riders would need to go to a different station • Some passengers have no increase in walk distance • Some passengers walk further but, the walk distance is on average one additional block 15
Effect on Walk Distance Existing Conditions Bus stop every 1/6th mile (900 feet) 16
Effect on Walk Distance All-in-One BRT station every 1/3rd mile 17
Comparison Summary Separate BRT and Local All-in-One Average Transit Travel Time + Transit Ridership + Auto Travel + Energy, Greenhouse Gases + Capital Cost + Operating Cost + Bicycle Environment + Traffic Impacts + Parking Impacts similar + Walk Access 20