Download
1 / 25
250 likes | 261 Views
Enhance coastal field measurements and models through GRASS GIS tools for interpolation, dynamic cartography, and simulations at multiple scales.

E N D
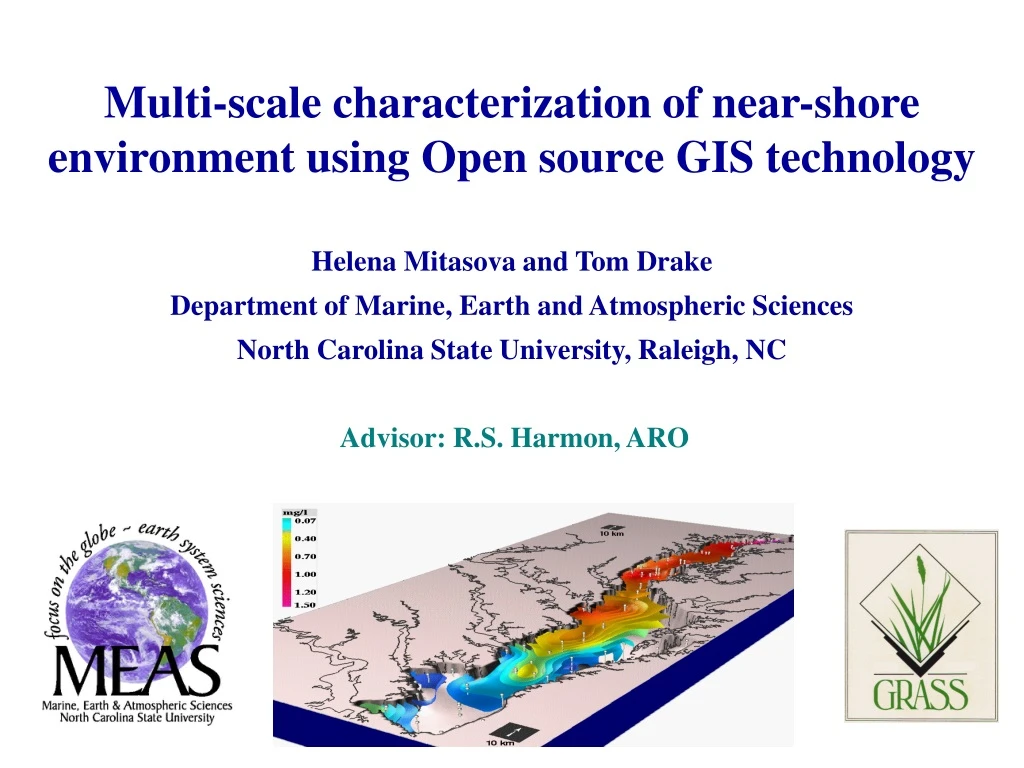
Multi-scale characterization of near-shore environment using Open source GIS technology Helena Mitasova and Tom Drake Department of Marine, Earth and Atmospheric Sciences North Carolina State University, Raleigh, NC Advisor: R.S. Harmon, ARO
GIS and the Environment Monitoring processing imagery and site environmental data, spatial access to data through Internet (USGS, EPA) Analysis and risk assessment integration of multiple-source data + spatial analysis Prediction, modeling, simulation numerical modeling for prediction of impacts Planning and decision support cost effective prevention and conservation Prepared by : H. Mitasova Images:GMSLab University of Illinois: T. Frank, W.Brown, W.Reez, D. Johnston Slide design: A. Mitas
Objective • Coastal field measurements and models involve processing, analysis and visualization of large volumes of spatial data, generated in different environments and formats. To support coastal applications GIS needs enhancements to improve support for large, heterogeneous, spatio-temporal data sets at multiple scales. • Goal • Enhance, develop and test Open source GIS GRASS tools for: • multivariate interpolation with analysis of geomorphology • multidimensional dynamic cartography • GIS support for coastal processes simulations
Open source GIS: GRASS General purpose GIS for raster, vector, site and image data processing for all flavors of UNIX: LINUX, MacOS X, Solaris, IRIX and WINDOWS/Cygwin. Originally developed at US Army CERL. Released under General Public Licence (GPL) as free to: run, study, modify, re-distribute, improve, and release (cannot be improved and released as proprietary) Lead development coordinator: Markus Neteler, ITC, Trento, Italy http://grass.itc.it/
Modeling withGRASS Raster: map algebra, topographic analysis, line of sight, solar radiation, cost surfaces, covariant analysis, buffers,… Vector: digitizing, overlay Imagery: processing of multispectral data, image rectification, principal component analysis, edge detection, … Sites: spatial interpolation, voronoi polygons, … Projections, transformation between data models, spatial interpolation, import/export Visualization: 2D display with zoom and pan, interactive 3D visualization with multiple surfaces, vector and site data Link to other OS projects: Map Server, OSSIM, R-stats, GSTATS…
Digital nearshore data • USGS DEM or NED: insufficient resolution • Traditional surveying and photogrammetry: points-> TINs -> contours (breaklines) • RTK GPS profiles: directional oversampling • LIDAR sweeps (no breaklines, oversampled) • Nearshore bathymetry: LARC profiles (directional oversampling), sonar • Fast, accurate and consistent transformation between the measured data and GIS data models are necessary: grid, contours (vector), sites (points), at various levels of detail USGS DEM RTK GPS LIDAR SONAR
Challenges • massive data sets (million points data sets) • unlabeled, oversampled data (no defined breaklines) • surfaces are complex and data are often noisy • anisotropy or directional oversampling is common • spatial coverage and accuracy may be heterogeneous • both statistical and geometrical accuracy is needed • almost all data are spatio-temporal
Relaxed Splines Relaxed spline method (regularized spline with tension - RST) was implemented in GRASS to support spatial interpolation of multivariate data. • Properties: • 2D, 3D and 4D implementation, • flexible properties through tension and smoothing, • simultaneous computation of slope, aspect, curvatures, • computation of deviations and cross-validation error, • segmented processing for large data sets. Examples
FRF Duck nearshore profiles: LARC Interpolation by RST with simultaneous computation of topographic parameters: slope and profile curvature Elevation Profile curvature In normal plane in gradient direction Slope
Jockey’s Ridge LIDAR: methods 1m rasterization, 3m rasterization RST interpolation: 1m resolution grid all points with distance > 0.5m preserved
Jockey’s Ridge curvature Curvatures computed by RST at 3 levels of detail, controlled by tension and smoothing, resolution is 2m, red is convex blue is concave
Jockey’s Ridge visualization LIDAR-based DEM (2m resolution) + IR DOQQ with modified color, visualized in GRASS5 NVIZ
Bald Head Island Data Renourished beach in 2001 Data: LIDAR 1997-2000, RTK GPS, NED NED RTK GPS LIDAR98 Dec. 2001 Jan. 2002 LIDAR2000
Bald Head Island change 1998-2000 1998 and 2000 LIDAR: 5m resolution rasterized
Bald Head slope and curvature 1999 Computed by RST at 2m resolution with high tension parameter (high level of detail). 2000 legend
Bald Head: slope and curvature 1999 2000 slope Computed by RST with lower tension profile curvature
Bald Head RTKS: Anisotropic data RTK GPS data are oversampled in the direction of the vehicle movement. Anisotropic interpolation is needed when distance between profiles is significantly greater than resolution. RST interpolation with default parameters RST with anisotropic tension, 1:10 at 160 deg anisotropy with incorrect angle (135 deg)
Bald Head Island change Dec.-Jan. January 2002 December 2001
Bald Head Island: moved volumes Jan. 2002 - Dec. 2001 RTK GPS total eroded: 149,000m3 total gained: 43,000m3 Aug. 2000 – Fall 1999 LIDAR total eroded: 445,000m3 total gained: 225,000m3
Simulation of processes Path sampling method uses duality between particle and field representation to solve the governing equations It is mesh free so it is easier to use with GIS than finite element or finite difference methods. Process can be modeled as evolution of particles or fields.
Overland flow sediment transport sand:high detachment and deposition rates, short distance transport clay: low detachment and deposition, long distance transport
Multiscale simulations Density of walkers is adjusted to resolution and is controlled by an importance sampling functionW(r) Entire area: 10m res., ~400x400 grid, Inset: 2m res., 600x400 grid
Conclusions RST method with simultaneous topographic analysis was applied to several types of data used for characterization of nearshore environment: LIDAR: Jockey's Ridge was interpolated at 1m resolution with analysis of surface geometry at various levels of detail. Improvement of performance for high density data points is being implemented. The 3D map of Jockey's Ridge with draped IR-DOQQ was created using GRASS GIS tool NVIZ. LIDAR and RTK GPS measurements were used to assess the change of the Bald Head Island shoreline, including in geomorphologic properties. Anisotropic tension was necessary for processing of RTK GPS profile data. The analysis has shown that after renourishment the pattern of erosion and deposition remains the same, possibly at higher rate. Technology Transfer Jockey’s Ridge LIDAR is included in the book on Open source GIS: the GRASS GIS approach, to be published in 2002. All improvements are tested and immediately released with the development version of GRASS GIS
What is next New generation interpolation: – faster, adaptable, with automatic optimization of parameters Support for spatio-temporal data beyond timestamp and animations Finish and enhance the support for volume data General path sampling simulation tool for GIS
GIS and the Future Key challenge: research, infrastructure and tools for employment of geospatial data for proactive protection of environment. Free access to spatial environmental data and tools: rapid development of new technologies for environment encouragement of environmentally responsible behavior Integration of monitoring, simulations and optimization: sustainable land use management, real-time response to environmental disasters, prevention unexpected environmental impacts Images : GMSLab University of Illinois at U-C: W. Brown, H. Mitasova Prepared by : H. Mitasova,