Download
1 / 33
340 likes | 365 Views
This comprehensive guide explores the pressing issues surrounding climate change, energy consumption, and environmental sustainability. Dive into the data, projections, and potential tipping points that signal the need for immediate action to avoid catastrophic outcomes. Discover the complexities of balancing economic growth with ecological preservation and the critical role of adaptation and mitigation strategies. Gain insights into the impact of carbon emissions, rising sea levels, extreme weather events, and the imperative to transition to sustainable energy sources. Join the global conversation on safeguarding our planet for future generations.

E N D
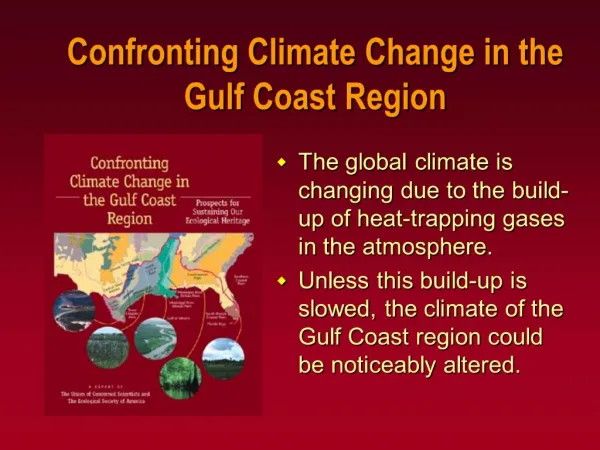
Confronting the Climate-Energy Challenge Daniel Schrag Harvard University daniel_schrag@harvard.edu
ECONOMY ENERGY CLIMATE ENVIRONMENT SECURITY
The Keeling Curve of CO2 in the atmosphere measured at Mauna Loa, Hawaii
2040 to 2060 2007 Atmospheric CO2 has never been higher than 300 ppm in the last 650,000 years (perhaps not in the last 35 million years) 300 275 250 Atmospheric CO2 (ppmv) 225 200 175 150 700,000 600,000 500,000 400,000 300,000 200,000 100,000 0 Age (years before present)
EOCENE (55 to 36 million years ago): The last time in Earth history when atmospheric CO2 was above 500 ppm. The Eocene climate was warm, even at high latitudes: -palm trees flourished in Wyoming -crocodiles lived in the Arctic -Antarctica was a coniferous forest -deep ocean temperature was 12°C (today it is ~2°C) -sea level was at least 100 meters higher than today
We are performing an experiment at a planetary scale that hasn’t been done for millions of years. No one knows exactly what is going to happen. There will be surprises.... DROUGHTS HEAT WAVES FLOODS STORMS SEA LEVEL RISE MOUNTAIN SNOWMELT WINNERS AND LOSERS
K. Emanuel, Nature, 2005. normalized power dissipation index/ sea surface temperature index Power dissipation by hurricanes tracks sea surface temperatures. The change was twice as large as predicted by theory.
TIPPING POINTS: instabilities in the Earth system that can change rapidly once thresholds are crossed. • ice sheets • carbon release from tundra (tropical forests)
CLIMATE CHANGE: Permafrost and the Global Carbon Budget Sergey A. Zimov, Edward A. G. Schuur, F. Stuart Chapin III Science 16 June 2006: Vol. 312. no. 5780, pp. 1612 - 1613 yedoma: soil composed of frozen loess with very high organic carbon content (2 to 3 % average) If there is >500 Gt C stored as organic carbon in permafrost in Siberia, how long will it take to ferment/oxidize as the permafrost regions warm?
Are the polar ice sheets vulnerable? West Antarctica: 6 meters sea level equivalent Greenland: 7 meters sea level equivalent We do not know how long it will take to melt these massive ice sheets. 1000 years? 500 years? 200 years?
Rate of Ice volume change: All Greenland: -238 km3/yr South Greenland: -164 km3/yr North Greenland: -65 km3/yr 73.250 N -238 km3/yr = 0.5 mm/yr sea level rise
What is the solution? How do we keep CO2 below a dangerous level? • • What level is dangerous? • • We must act quickly because of long lifetime of CO2 in the atmosphere and the long lifetime of energy capital investments, particularly in China and other rapidly developing countries. • • ADAPTATION and MITIGATION are essential
Adaptation and Mitigation Substantial climate change is unavoidable. Substantial climate change is unavoidable. Therefore, adaptation is essential. Therefore, adaptation is essential. Adaptation will not be cheap.
Adaptation and Mitigation Substantial climate change is unavoidable. Therefore, adaptation is essential. Adaptation will not be cheap. Without mitigation, adaptation becomes impossible…
150 years of energy growth based mainly on fossil fuels brought us to today’s dilemma Hydro+ means hydropower plus other renewables besides biomass Energy supply grew 20-fold between 1850 and 2000. Fossil-fuel use grew 140-fold.
2006 2005 Trajectory of Global Fossil Fuel Emissions 50-year constant growth rates to 2050 B1 1.1%, A1B 1.7%, A2 1.8% A1FI 2.4% CO2 emissions (Gt C/y) Observed 2000-2006 3.3% Raupach et al. 2007, PNAS
Man-made Greenhouse Gas Emissions (2006E)* CO2 Emissions Sources (2006E)** Industrial Processes4% Halocarbons Residential & Other Fuel Combustion 11% Methane15% Transportation 23% Electricity & Cogeneration44% CO2 74% Manufacturing & Construction 18% 39.8 Gigatonnes CO2 Equivalent† 29.5 Gigatonnes CO2 *Estimated from 2000 anchor data **Estimated from 2003 anchor data **Non-CO2 emissions are expressed in CO2 equivalents using 100-year global warming potentials found in the IPCC Second Assessment Report Source: EIA, International Energy Agency (IEA), Intergovernmental Panel on Climate Change (IPCC), World Resources Institute and AllianceBernstein
Megatonnes CO2 60 50 40 30 20 10 0 Most Emissions Come from Relatively Few Sources • In 2005, 150 stationary sources emitted as much CO2 as the global car fleet Delete for book 150 Source: IEA and AllianceBernstein
Most Emissions Come from Relatively Few Sources Megatonnes CO2 • In 2005, 150 stationary sources emitted as much CO2 as the global car fleet • The largest 1,000 stationary sources account for 31% of global CO2 emissions • 260 are in the US and 240 are in China • 875 are power-generating plants 60 50 40 Delete for book 30 20 10 0 150 1000 Source: IEA and AllianceBernstein
Most Emissions Come from Relatively Few Sources Megatonnes CO2 • In 2005, 150 stationary sources emitted as much CO2 as the global car fleet • The largest 1,000 stationary sources account for 31% of global CO2 emissions • 260 are in the US and 240 are in China • 875 are power-generating plants • Fewer than 8,000 stationary sources emit 50% of man-made CO2 60 50 40 30 20 10 0 150 2000 1000 Source: IEA and AllianceBernstein
Price of Electricity Tends to Drive Efficiency (GNP$/kWh) High Efficiency Denmark UK Japan US Belgium Norway India China Low Efficiency Low Price High Price ($/kWh) Data from 2000 Source: EIA, World Bank and AllianceBernstein
Regulation Can Also Drive Efficiency (kWh) Electricity Consumption per Capita United States California Western Europe Source: California Energy Commission, California Public Utilities Commission, European Union and US Department of Energy
What if scientists are wrong and climate change happens faster than we expect? • What would we do if Greenland or West Antarctica started to rapidly collapse?
Climate Engineering: some questions How do we do it? What does it do to the climate system? What might go wrong? Does it postpone the need to reduce CO2 emissions? Will it postpone the reduction of CO2 emissions? Who controls it? When should we start (if at all)? What do we need to know before we start?