Download
1 / 108
1.14k likes | 1.6k Views
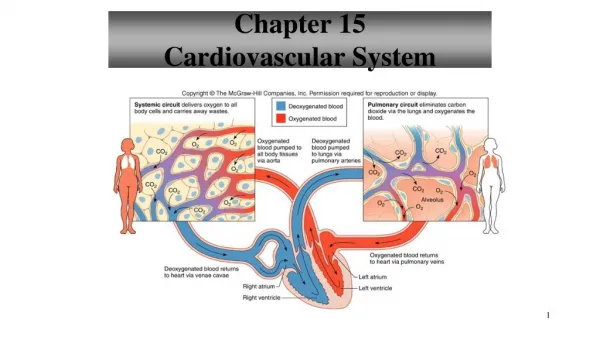
Chapter 4 Cardiovascular system. The heart Electrical and mechanical activities The vascular system Blood pressure Regulation of the cardiovascular system. Blood and Body Fluid The Heart and Circulatory system. Anatomy of the heart. Section 1 Bioelectricity of the heart. RP and AP

E N D
Chapter 4 Cardiovascular system • The heart • Electrical and mechanical activities • The vascular system • Blood pressure • Regulation of the cardiovascular system
Blood and Body Fluid The Heart and Circulatory system
Section 1 Bioelectricity of the heart • RP and AP • Non-automatic cell: working cell • Automatic cell: Sinoatrial node (SAN), AV node, Purkinje cell
Working cell • Resting Potential: • -90mv, an equilibrium potential of K+. • Ik1 channel • Action potential: • Phase 0,1,2,3,4
Ventricular Action potential (a) (b) AP 2 Cardiac myocyte 1 0 0 3 Vm (mV) 4 -90 (d) Ionic changes (c) 5 Phases of cardiac AP IK Phase 0: Upstroke Phase 1: Early partial repolarization Phase 2:Plateau phase Phase 3: Repolarization Phase 4: Resting membrane potential ICa INa
2 1 0 0 3 Vm (mV) • Phase 0: • Upstroke • –90mv to +20-30mv • Duration: 1-2 ms • Max. Velocity: 200-400 v/s • Fast sodium channel • Fast response cell • Blocker is tetrodoxin (TTX, fugu). • A rapid depolarization towards Na+ equilibrium potential, then Na+ channel inactivate. 4 -90 0 100 200 300ms
2 1 0 0 3 Vm (mV) • Phase 1: • Early partial repolarization. • From +20 mv to 0 mv • Duration: 10 ms • Closing of Na+ channel, • Opening of K+ channel: transient outward current (Ito). 4 -90 0 100 200 300ms
2 1 0 0 3 Vm (mV) • Phase 2: • Plateau phase: 0 mv • Symbol of AP • Duration: 100-150 ms • A balance of Ca2+ influx and K+ outflux • Ca2+ channel: L-type (long-lasting). • Slow channel, blocker is Mn2+, verapamil. • K+ channel: Ik1, Ik • Ik1: inwardly rectifying K+ channel, active at rest. • Ik: delayed rectifying K+ channel, opens slowly. 4 -90 0 100 200 300ms
2 1 0 0 3 Vm (mV) • Phase 3: • Repolarization, 150ms • Close L-type Ca2+ channel • K+ channel outflux • Ik: progressively increase • Ik1: open in late period when near to RP. • Phase 4: • Na+-K+ pump • Ca2+ pump • Ca2+-Na+ exchanger 4 -90 0 100 200 300ms
Autonomic cells • Various automaticity: • SAN: 100/min • AVN: 50/min • (Slow response AP) • Purkinjie fibers:25/min • (Fast response AP)
SAN: pacemaker cell 0 • Phase 0, 3, 4 • Threshold: -40mv • Automatic depolarization of Phase 4 • No resting potential, in stead of a maximum diastolic potential (MDP). • No significant overshoot and plateau 3 4
Phase 0: • Depolarization: -40 to 10 mv. • Ca2+ influx (L-type) • A slow upstroke (10v/s) • Blocked by Mn2+ • Phase 3: • Repolarization: 0 mv to MDP. • K+ outflux (Ik channel) • Ca2+ channel inactivated. • Phase 4: • A progressive reduction of IK. • Influx of Na+ (If, funny, not fast Na channel, blocked by Cs). • Influx of Ca2+ (T-type)
Electrophysiological properties • Excitability • Automaticity • Conductivity • Contractility
Excitability • Ability to produce AP • ARP: • phase 0 ~ -55mv, no AP produced. • ERP: • -55~-60mv, local response produced. • Phase 0 ~ -60mv • RRP: - 60mv~-80mv. • SP: -80mv~-90mv.
Affecting factors: • Resting potential: • Threshold: • Na+ channel status: activited, inactivited.
Automaticity • Ability to initiate its own beat. • Various automaticity: • SAN: 90~100 beats/min • AVN: 40~60 beats/min. • Purkinjie fibers: 15~40 beats/min. • Normal and abnormal automaticity: • Normal: SA node as pacemaker • Abnormal : other than SA as pacemaker
Affecting factors: • Rate of depolarization of phase 4 • Maximum diastolic potential (MDP) • The difference to threshold
Conductivity • Conductivity of AP between cardiac cells: • Intercalated disc. • Conductivity of AP in heart: • Specialized conducting system.
Electrotonic conduction through gap junction Low resistance Functional syncytium
Electrical conduction through the heart SV Impulse initiated in SAN L_Atrium Bundle of His Propagates thru atria toAVN SAN Bundle branches R_Atrium From the AVN, impulse is conducted rapidly to all parts of the ventricle by thePurkinje fibres L_Ventricle Purkinje fibres AVN Papillary muscle Venticles contract R_Ventricle Purkinje fibres
SV L_Atrium Bundle of His • Velocity of conduction: • Internodal tract: 1.7 m/s • Nodal area: 0.02 m/s • Purkinje fiber: 4.0 m/s • Ventricular muscle: 1.0 m/s SAN Bundle branches L_Ventricle AVN Purkinje fibres Papillary muscle R_Ventricle Purkinje fibres • Properties and significance • Atria-Ventricle delay: Ventricles have enough time to fill • Synchronous contraction: Insures symmetry of the contraction
Contractility • All or none: functional syncytium • Without complete tetanic contraction: ERP • Contraction and relaxation cycles is crucial for function properly.
Dependent on [Ca2+ ]o • Digitalis:increase intracellular Ca2+ by inhibiting Na pump.
Extrasystole and compensatory pause • Extrasystole: contraction evoked in relaxation of ventricle. • Compensatory pause: A prolonged interval pause, followed the extrasystole. • Affecting factors: • Ca2+ • Sympasythetic nerve ES CP
Electrocardiogram (ECG) • Bioelectricity of heart recorded from surface of body. • Summation of individual cardiac cells • Limb leads and precordial leads • Vector: • Produced between a positive and negative poles. • Direction of vector coincide with two electrodes, upward deflection.
Typical ECG recording Lead II R Right arm T P Q 200 ms S Left leg Summary of Electrocardiogram 1. P wave: Spread of excitation over the atria 2. QRS interval: Spread of excitation over the ventricles 3. T wave: Spread of repolarization over the ventricles
Muscle near to atria Ventricule depor. Atrium depor. Conduction travels first thru. Left ventricle Ventricule repor. From septum towards apex, and from endocardium to epicardium
PR interval: • Time of AP conductivity from atria to ventricle. • Q-T interval: • Interval from QRS complex to end of T wave. • S-T segment: • Time from end of QRS complex to onset of T wave.
Atrioventricular blocks Normal ECG (a) R P 1st degree heart block (long PR interval) (b) R P 2nd degree heart block (2/1 block) (c) (d)
Cardiac arrhythmias • Atrial fibrillation • Ventricular fibrillation • Hypertrophy • Ischemia
Section 2 Mechanical activity of heart • Systole to push blood, diastole to fill blood • Right ventricle into pulmonary circulation. • Left ventricle into systemic circulation.
Systole Diastole Atria 0.1s 0.7s Ventricle 0.3s 0.5s • Heart rate (HR) • Times of heart beat in one minute. • 60~100 beats /min, average HR is 75 beats/min. • Cardiac cycle: • Duration of heart beats one time. Includes systole and diastole. 0.8s
v-c:0.3s a-c: atria contract a-r: atria relax v-c: ventricle contract v-r: ventricle relax a-r: 0.7s a-c:0.1s v-r: 0.5s Cardiac cycle
Processes of cardiac cycle • Isovolumetric contraction • Rapid ejection • Reduced ejection • Isovolumetric relaxation • Rapid filling • Reduced filling • Atrial contraction
Rapid ejection: 0.10s. Slow ejection: 0.15s. Ventri. Contract Pv Patrium Pv Paorta Mitrial valve close, and aortic valve do not open yet. Volume of ventricles is almost same Ventri. Contract further Pv Paortic Aortic valve open 2/3 blood enter aorta Small amounts of blood enter due to the Momentum Pressure gradient decrease, even less than aortic pressure Isovolumetric contraction (0.05s)
Rapid filling: 0.11s. Slow filling: 0.22s. Ventri. Relax Pv Paorta Pv Patrium Aortic valveclose, andMitrial valvedo not open yet. Volume of ventricles is almost same Ventri. relax further Pv Patrium Mitrial valve open 2/3 blood attracted into ventricle Small amounts of blood enter with the decrease of pressure gradient Isovolumetric relaxation (0.06~0.08s) Atrial contraction: 0.1s 10-30% blood was pushed into ventricles.
Characteristics of cardiac cycle • Driving force: pressure gradient. • Valves play important roles in cardiac cycle. • Change of Pleft-v is bigger than Pright-v. • Stroke volumes of left and right ventricle are same. • Paorta is lowest in isovolumetric ventricular contraction phase. • Paorta is higher than Pv in reduced ejection phase. • Volume of ventricles is lowest at reduced ejection phase.
Heart sound • A phonocardiogram with stethoscope • The first heart sound: lub • Closure of mitral and tricuspid valves • Semilunar valves open • Longer, louder, low pitched • Represent ventricular systole. • The second heart sound: dup • Closure of aortic and pulmonic valves • Shorter, high pitched • Represent ventricular diastole. • The third and fourth sounds
Cardiac output • Stroke volume • Volume of blood pumped out of each ventricle per beat. • 60~80ml, about 70 ml. • Ejection fraction: • Stroke volume/End-diastole volume (145~160 ml), 55~60%. • To assess heart work.
Minute output: Cardiac output • The output of the heart per minute. • CO = SV HR • 4~6 L, average 5L. • Cardiac index: • Cardiac output/ square meter of body surface. • 3~3.5L/min/m2 • To evaluate the difference of individuals.
Factors affecting cardiac output • End diastole volume • Preload: filling, cardiac muscle fiber length. • Heterometric regulation: • Regulation of output by changing preload. • Preload , stroke volume. • Affected by factors such as venous return, atrial contraction, heart failure.
Aortic or arterial pressure: • Afterload: resistance against CO. 80~170mmHg. • Afterload muscle contract CO • Afterload reduced ejection CO • Hypertrophy: • Atherosclerosis PR compensatory hypertrophy. • Heart rate • Within 60-180 beats/min, CO increase by increase HR.
Cardiac contractility • Affected by nerve (main sympathetics) • Hormones (AD, NE).
Cardiac reserve • Definition: • Ability of heart to increase CO to meet demand of metabolism of body. • Composition: • HR reserve: 60~180 • Stroke reserve • Systole reserve: 70ml to 125ml. • Diastole reserve: 145ml to 160ml.
Section 3 The blood vessels • Arterial pressure • Venous return • Microcirculation • Formation of interstitial fluid
Elastic vessel Resistance vessel Exchanges vessels Capacitance vessel