Download
1 / 55
910 likes | 1.72k Views
EARTH SCIENCE REFERENCE TABLES. REVIEW Pages 1 - 16. Page 1. Radioactive Decay Data Specific Heats of Common Materials Equations Properties of Water Average Chemical Composition of Earth’s Crust, Hydrosphere, and Troposphere Eurypterus remipes (NYS fossil). Page 1. Eurypterus remipes

E N D
EARTH SCIENCEREFERENCE TABLES REVIEW Pages 1 - 16
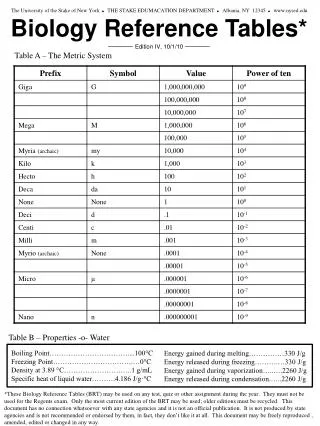
Page 1 Radioactive Decay Data Specific Heats of Common Materials Equations Properties of Water Average Chemical Composition of Earth’s Crust, Hydrosphere, and Troposphere Eurypterus remipes (NYS fossil)
Page 1 Eurypterus remipes (NYS fossil)
Page 2 Generalized Landscape Regions of New York State Landscape regions are identified on the basis of their similar surface characteristics
Page 3 Generalized Bedrock Geology of New York State City locations, latitude and longitude, geologic periods and eras, and rock types in NYS are found on this page
Page 4 Surface Ocean Currents Ocean currents influence coastal climate patterns
Page 5 Tectonic Plates Crustal plate movement is caused by convection currents due to unequal heating of magma in the upper part of the Earth’s mantle (asthenosphere)
Page 6 Rock Cycle in Earth’s Crust
Page 6 Relationship of Transported Particle Size to Water Velocity This graph shows the velocity of a stream compared to the size rock particle it can carry – example: a pebble measuring 1.0cm in diameter can travel in water flowing 50cm per second
Page 6 Igneous rocks are formed by melting and solidification of minerals. Igneous rocks are identified by the size (fine or coarse) and color (felsic or mafic) of their mineral crystals. Scheme for Igneous Rock Identification
Page 7 Scheme for Sedimentary Rock Identification Sedimentary rocks are formed by compaction and cementation of minerals. Sedimentary rocks are identified by the particle texture (sediments, fossils) that forms them.
Page 7 Metamorphic rocks are formed by intense heat and/or pressure. Metamorphic rocks are identified by the arrangement of their mineral crystals. Examples: Foliated – crystals arranged in layers (banding) Non-foliated – crystals not in layers (distorted) Scheme for Metamorphic Rock Identification
Pages 8 and 9 These two pages show the history of life on Earth (including extinctions) and important geologic events that have occurred in the past (oceans and mountains forming, Pangaea forming and breaking up, magma intrusion of the Palisades sill, and the advance and retreat of the last continental ice (glaciers) Geologic History of New York State
Page 8 • Time units • Life on Earth • NY Rock Record
Page 9 • Time Distribution of Fossils • Important Geologic Events in New York • Inferred Positions of Earth’s Landmasses
Page 10 • This page shows the four properties of the Earth’s interior: • Depth • Temperature • Pressure • Density • As depth increases: temperature, pressure, and density increase. Inferred Properties of Earth’s Interior
Page 10 • Depth • Temperature • Pressure • Density • As depth increases: temperature, pressure, and density increase.
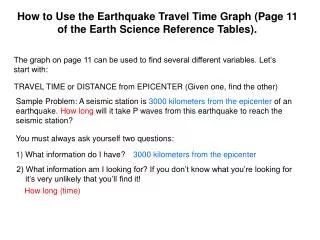
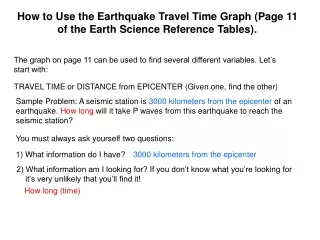
Page 11 The graph on this page is used to determine the distance an earthquake wave travels based on how much time it takes for the earthquake P wave and S wave to reach a seismic recording station. You can also determine how long it takes for the earthquake wave to travel if you know the distance it traveled. Earthquake P-wave and S-wave Travel Time
Page 12 This chart shows the dewpoint temperature of the atmosphere based on the dry bulb temperature (air temperature) and the difference between the wet-bulb (humidity) and the dry-bulb (air temperature). The dewpoint temperature of the atmosphere is the temperature at which the air molecules condense and form liquid clouds. Dewpoint (oC)
Page 12 This chart shows the percent humidity in the atmosphere. The higher the percent of humidity, the more saturated the air is. The more saturated the air is, the greater the chance for precipitation. High humidity = more cloud cover Low humidity = less cloud cover Relative Humidity (%)
Page 13 Temperature (Fahrenheit, Celsius, Kelvin) Pressure (millibars, inches) Key to Weather Map Symbols Station Model Explanation & Station Model Present Weather Air Masses Fronts Hurricane
Page 14 The graph on this page shows how the properties of the atmosphere change as altitude (height above sea level) increases. Temperature decreases, atmospheric pressure decreases, and the amount of water vapor in the atmosphere decreases as you increase in altitude. Selected Properties of Earth’s Atmosphere
Page 14 This diagram indicates the direction of the major planetary winds on the Earth’s surface in the troposphere. Winds are named for the direction they come from. The direction of the arrows indicate if the wind is converging (warm, humid air rising and forming clouds) or diverging (cold, dry air sinking) at the Earth’s surface. The moisture belts are indicated as wet or dry depending if the air is converging or diverging. Planetary Wind and Moisture Belts in the Troposphere
Page 14 This chart shows the different types of electromagnetic waves and their different wavelengths. If the wavelength increases, storm systems and stars are moving away from you (red shift) and if the wavelength decreases storm systems and stars are moving toward you (blue shift). Electromagnetic Spectrum
Page 14 Red visible light (increasing wavelength) Violet/blue visible light (decreasing wavelength)
Page 15 This graph shows the characteristics of stars and their life cycle from early stage through late stage development. Luminosity is the brightness of a star. The more massive a star is, the greater its luminosity. Cooler stars are red stars and hotter stars are blue stars. All stars begin on the Main Sequence in the early stage as hot, massive, blue stars, and move down the Main Sequence to become a Supergiant or Giant Star, then eventually a small, hot White Dwarf star. Eventually, they use up all their gases and explode into a supernova. Luminosity and Temperature of Stars