Download
1 / 10
100 likes | 239 Views
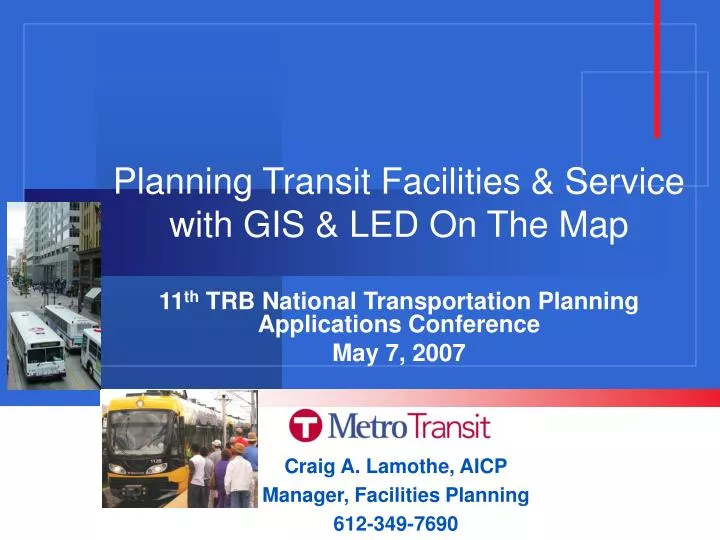
Planning Transit Facilities & Service with GIS & LED On The Map. 11 th TRB National Transportation Planning Applications Conference May 7, 2007. Craig A. Lamothe, AICP Manager, Facilities Planning 612-349-7690. OTM Limitations. For Transit Planning ½ Mile Buffer Minimum

E N D
Planning Transit Facilities & Service with GIS & LED On The Map 11th TRB National Transportation Planning Applications Conference May 7, 2007 Craig A. Lamothe, AICP Manager, Facilities Planning 612-349-7690
OTM Limitations For Transit Planning • ½ Mile Buffer Minimum • Limited Static Layers • Single O-D Pair Analysis • Block Group Selection Aggregation • Integration with Other Datasets
OTM Data Use Outside the Online Tool • Step 1: Acquire the OTM Dataset • Step 2: Find Someone with MS Access & ESRI ArcGIS Experience • Step 3: Create Study Area Specific Data File(s) • Step 4: Conduct Your Mapping & Analysis
QUESTIONS Craig A. Lamothe, AICP Manager, Facilities Planning 612-349-7690 craig.lamothe@metc.state.mn.us