Download
1 / 25
260 likes | 304 Views
Understand utility, marginal utility, indifference curves, budget lines, optimal consumption levels, income and price effects on demand. Learn to trace demand curves for goods. Consumer utility theory at the core.

E N D
Chapter 5: Utility Analysis Utility: A Measure of the Amount of SATISFACTION A Consumer Derives from Units of a Good
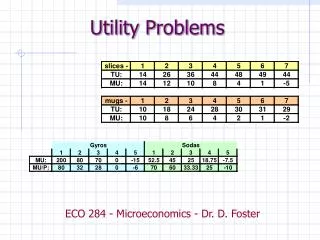
Utility as a basis for Demand David's Utility Schedule for Hamburgers Total Utility Number 0 0 1 6 2 11 3 15 4 18 5 20 6 21 7 21.1
Diminishing Marginal Utility: Each ADDITIONAL hamburger Produces Less and Less ADDITIONAL SATISFACTION
David's Utility Schedule for Hamburgers Number Marginal Utility Total Utility 0 0 (6-0)/1 = 6 1 6 (11-6)/1 = 5 2 11 (15-11)/1 = 4 3 15 (18-15)/1 = 3 4 18 (20-18)/1 = 2 5 20 (21-20)/1 = 1 6 21 (21.1-21)/1 = 0.1 7 21.1 Each additional hamburger produces less and less additional utility
Indifference Curve: All Possible Combinations of Two Goods that Produce the Same Amount of Total Utility
An Indifference Curve: The consumer is equally happy (satisfied) at any of the points along a single curve
An Indifference Curve represents the same amount of utility everywhere
"Convex to the Origin" Preference For some of both Hamburgers and French Fries Indifference Curve for One Utility Level
Indifference curves never touch or intersect each other Indifference Curves for each Utility Level
Indifference Map utility level 4 More Utility utility level 3 utility level 2 utility level 1
Budget Line Assume: Price of Hamburger is $1.00 Price of French Fries is $.50 Income is 7.50 Could Purchase 7.5 Hamburgers 0 French Fries or 15 French Fries, 0 Hamburgers or 9 French Fries, 3 Hamburgers Many other feasible combinations with the $7.50 of income
Budget Line for $7.50 Income Combinations of Hamburgers & French Fries that can be Purchased for $7.50
An Indifference Curve and Budget Line Specific utility level
Point of Tangency between Budget Line and Indifference Curve Determines Optimum Quantities of Hamburgers and French Fries 3
Indifference Curve Map utility level 5 9 utility level 4 utility level 3 utility level 1 utility level 2
Price of Hamburgers /Price of French Fries = Slope of Budget Line Marginal Rate of Substitution of Hamburgers for French Fries = Slope of Indifference Curve
Optimum Combination: 3 Hamburgers, 9 French Fries where Price of Hamburgers/Price of French Fries = Marginal Rate of Substitution of Hamburgers for French Fries
Impact of More Income A new, higher budget line with the same slope but reaches a higher indifference curve
Budget Line for $7.50 and $12.50 Income $12.50 $7.50
Impact of Price Change for Hamburgers Hamburgers Special Today Hamburgers All you can eat $3.75 each 50 cents each
Price of Hamburgers decreases to $.50 9 Hamburgers x $.50 = 4.50 6 French Fries x $.50 = $3.00 still spent $7.50 total 6 9
Price of Hamburgers now $3.75 Quantity of Hamburgers now taken: 1 How many French Fries ??
Tracing the Demand Curve for Hamburgers A Demand Schedule for Hamburgers Price Quantity Demanded 3.75 1 Price of Hamburgers 1.00 3 3.75 0.50 9 1.00 Demand .5 3 1 9 Quantity Demanded per unit of time
Consumer demand has its roots in consumer utility theory Price D Quantity/ unit of time