Download
1 / 4
40 likes | 152 Views
Ch. 8: Correlation. Reading a scatterplot – graphical interpretation of the relationship between 2 variables Independent and dependent variables Examples: Mars rocks AAVP data SAT scores vs. essay length Ex. A #6 p.124. Correlation Coefficient ( r )

E N D
Ch. 8: Correlation • Reading a scatterplot – graphical interpretation of the relationship between 2 variables • Independent and dependent variables • Examples: • Mars rocks • AAVP data • SAT scores vs. essay length • Ex. A #6 p.124
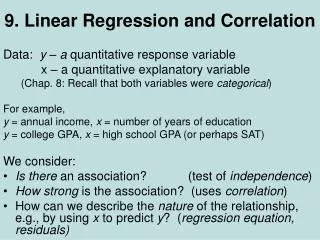
Correlation Coefficient (r) • Measure of linear association (clustering, tightness) • The relationship between 2 variables can be summarized by: • Average of the x-values • SD of x-values • Average of the y-values • SD of the y-values • r
Correlation coefficients are always between -1 and 1. • A positive correlation vs. a negative correlation. • Standard Deviation Line: A line that goes through the point of averages and through all points which are an equal number of SDs away from the average, for both variables. • Slope =
Computing r • Convert each variable to standard units • Take the average of the products • Example: Ex. D #1(a)