Download
1 / 21
220 likes | 404 Views
Seismo - Acoustic data analysis at I34MN Mongolia - Songino. RESEARCH CENTRE OF ASTRONOMY AND GEOPHYSICS OF MONGOLIAN ACADEMY OF SCIENCES. Ch. Bayarsaikhan, M. Ulziibat, A. Le Pichon, A. Schlupp. TOPICS. DESCRIPTION OF MINE EXPLOSIONS AROUND I34MN SEISMO-ACOUSTIC DATA ANALYSIS

E N D
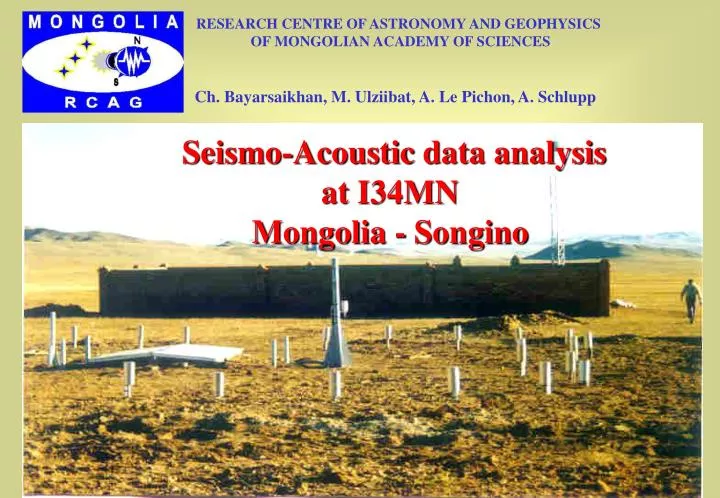
Seismo-Acoustic data analysis atI34MNMongolia - Songino RESEARCH CENTRE OF ASTRONOMY AND GEOPHYSICS OF MONGOLIAN ACADEMY OF SCIENCES Ch. Bayarsaikhan, M. Ulziibat, A. Le Pichon, A. Schlupp
TOPICS • DESCRIPTION OF MINE EXPLOSIONS AROUND I34MN • SEISMO-ACOUSTIC DATA ANALYSIS • STATISTICS AND VARIABILITY OF THE PROPAGATION PARAMETERS OF MINE EXPLOSIONS • EVALUATION OF THE CELERITY • SEASONAL VARIATION OF INFRASONIC DETECTION • CONCLUSION
I34MNINFRASOUND STATION IN SONGINO Four infrasound sensors arranged as a triangular array of 3 km aperture.
WIND-NOISE REDUCING SYSTEM 6-15 dB @ 1-5 Hz Wind noise Signals Gravel filters for wind noise reducing
SEISMICNETWORK Seismic stations are equipped with 9 vertical component short-period seismometers and one tree component short and long period seismic sensors. The 10 seismic stations which form double circled array with radius 1-3 km.
Several large mines in the region routinely generate explosions that are detected seismically and with infrasound sensors. Mines are located 40-500 km from the seismic and infrasound array. Baganuur coal mine, 180 km east of the array, regularly produces 5-10 seismic detections per week. Erdenet copper mine, which located 300 km north-west produces several explosions every week between 06-07 UTM time. Shariin gol Mine 181.1 km north-east. Borundur 302.2 km south-east. Bagahangai 97.8 km east-south. …
IDENTIFYING AND LOCALIZATION OF QUARRY BLAST USING SEISMIC DATA • Real time processing and interpretation of seismic data from 15 seismic stations • For identifying quarry blast we use waveforms, first motion, magnitude ratio of Ms and Ml. • JADE and ONYX software are used for determining location and origin time of quarry blast. • Results are stored in Oracle database.
JADE I arrivals ~10 min
SEISMIC LOCATIONS Quarries identification Baganuur Erdenet Others Shariingol
INFRASONIC DATA PROCESSING JADE WinPmcc ~12 min + I arrivals • Infra and seismic continuous real time data observation in JADE • Automatic processing of Infrasonic data done by PMCC(0.02-4 Hz) • Detailed processing of data is done manually using WinPmcc
WinPmcc analysis: different arrivals generated by one explosion
VARIABILITY OF THE PROPAGATION PARAMETERSERDENET MINE Average number of detection on 2000-2001 from April to September no detection Average azimuth on 2000-2001 Average trace velocity on 2000-2001 Azimuth: 309-314 ° Celerity: 0.30 – 0.34 km/s Trace velocity: 0.35 km/s
VARIABILITY OF THE PROPAGATION PARAMETERSBAGANUUR MINE Average number of detection on 2000-2001 from March to July no detection Average azimuth on 2000-2001 Average trace velocity on 2000-2001 Azimuth: 89-92 ° Celerity: 0.25-0.30 km/s Trace velocity: 0.32-0.36 km/s
The distance to Baganuur coal mine is 150 km • and travel time of infrasonic wave is 500-600 sec • The distance to Erdenet copper mine is 300 km • and travel time of infrasonic wave is 650-750 sec • The distance to Shariingol coal mine is 180 km • and travel time of infrasonic wave is 550-600 sec • The distances to other coal mines are in 300 km • range and travel time of infrasonic wave is • 800-900 sec CELERITY ESTIMATION Celerity calculated using all explosion data C = 0.25-0.30 km/s
SEASONAL VARIATION OF INFRASONIC DETECTION • Seasonal variation of the detections are observed. • Baganuur mine explosions are made not on fixed time • in July and August we got 4 detections. • Blue is detections of Infrasound • Red is seismic detections • For the Erdenet copper mine explosions, we have clear • seasonal variation. • Erdenet mine is making every week one series of • explosions. From November to February, ~50% of the explosions generate also infrasonic arrivals.
STATISTICS ON ALL DETECTIONS AUTOMATICALLY DETECTED BY PMCC Azimuth distribution of infrasonic detection on 2000-2001 I II III V VI IV Statistics on the number of detections from the automatic bulletin 0.1-4 Hz 2000-2001 VII VIII IX The source of detection is mainly from mine explosions, military activity, city noises and also some time from large teleseismic events XI X XII
CONCLUSION • Because of surrounding mines, explosions are detected by both • Infrasound and Seismic stations. The seismo-acoustic synergy enables • a fine analysis of the source. • The detections of Infrasound station clearly depend on the • season: propagation effects and wind-noise variability. • Future work: automatic association of I and S arrivals for quarries location.