Download

1 / 24
240 likes | 250 Views
Explore the physics of dry and moist air, including potential temperature, pseudo-adiabatic charts, skew T-ln p charts, and Normand’s Rule. Learn about variables like mixing ratio, relative humidity, and dew point, all essential in understanding the behavior of saturated air. Study the differences between dry and moist air in atmospheric thermodynamics. Enhance your knowledge with examples and practical applications.

E N D
L14 Physics of dry air and moist air • Potential temperature • Pseudo-adiabatic charts • Skew T – ln p charts • Moist air • Saturated adiabatic lapse rate • Normand’s Rule: Cloud base
Potential Temperature (θ) • The potential temperature of an air parcel is its temperature when compressed (or expanded) adiabatically to surface pressure (p0) (defined as a standard pressure of 1000 hPa). • Again, start from the 1st Law of Thermodynamics, and make dq=0:
Ideal Gas Law (see Lecture 8) so: R is the specific gas constant for air R = 287 J kg-1 K-1 substitute in α:
Divide by RT: Integrate both sides, from the starting (p,T) tothe surface (p0,T0), noting cp/R is a constant: Remember integral of 1/x is the natural log of x:
R = 287 J kg-1 K-1 cp = 1004 J kg-1 K-1 Hence R/cp = 0.286 Integrating: Remember: Hence: or: Rearrange to give potential temperature, θ:
Happily, we can look at this graphically:e.g., the ‘Pseudo-adiabatic’ chart • So if you plot: p0.286 on y-axis,T on x-axis • For a constant θ, (p00.286/θ) is also a constant, so the graph yields a straight line with gradient given by (p00.286/θ), and passing through T=0 and p=0 Re-arrange:
Earth’satmosphere Pseudo-adiabatic chart Useful as now we can follow each line and determine graphically temperature at any pressure, assuming adiabatic expansion/compression y-axis is linear for p0.286 also linear for ln(p)
Earth’s atmosphere Pseudo-adiabatic chart Solves Poisson’s equation graphically! Disadvantage: Everything happens in small region of the chart… This can be overcome by skewing the temperature lines rather than plotting them straight up → The Skew T-ln p chart Earth’s atmosphere is never here
Skew T-ln pchartdifference to pseudo-adiabatic: ln(p) rather than p0.286T skewed • Examples: • Kuching in Malaysia • Valentia in Ireland. Vertical T Skew T
saturationmixingratio What are all the lines on the skew T-ln p chart? isobar isotherm dryadiabat saturated adiabat
Example: airplane air If an airplane at 250hPa takes air in at -51oC and adjusts it to cabin pressure (850 hPa), does the air have to be • Heated • Cooled to be comfortable?
Cabin pressure850 hPa Temperature ~43°C Followthe dry adiabatto 850 hPa
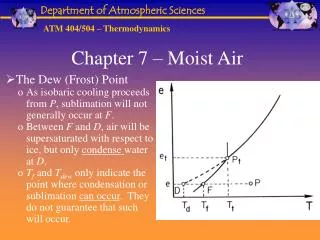
Moist air • See: L6 Humidity • Air contains some H2O molecules (water vapour) • Vapour pressure (e): partial pressure exerted by the gaseous water (hPa) • Mixing ratio (w): mass of water vapour / mass of dry air • Warmer air can accommodate more water molecules; the maximum for a given temperature is when the air is ‘saturated’ • For a given temperature, there is a:saturation vapour pressure (es)saturation mixing ratio (ws) • An air parcel can become saturated, e.g. by ascent and cooling • Once saturated, further cooling will result in condensation of liquid water: i.e. cloud droplets
evaporation condensation Mixing ratio w = mvapour/mdry [normally given units g/kg] At saturation: evaporation balances condensation Saturation mixing ratio ws = 0.622 es / p Relative Humidity = w/ws x 100% = e/es x 100%
Thermodynamics of saturated air • As long as air remains unsaturated, it will behave like ‘dry’ air • However, once saturated, the condensation of liquid water releases latent heat • This means that an ascending air parcel that becomes saturated will cool less than one that remains unsaturated • We can theoretically derive how much the cooling is modified (not done here, see Wallace & Hobbs p79-87 if interested), and define the ‘Saturated Adiabatic Lapse Rate’ (SALR) • The difference between the DALR and a SALR is largest for warmer air, as the water vapour content, and hence latent heat release are larger • Saturated adiabats are solid green lines on the skew T-ln p chart
Saturation mixing ratio Derived Using ideal gas law, and def. of saturation water vapour pressure (Clausius Clapeyron, Dr Essery) Constant p: w increases with T Constant T: w increases with decreasing p
w = 6 g/kg ws Relative humidity: RH = 100*e/es ≈ 100*w/ws Dewpoint (Td): Temperature to which air must cool at constant pressure to be saturated Q: Air at 1000 hPa and 18oC has a mixing ratio of 6 g/kg. What is its relative humidity and dewpoint? RH=6/13*100=46% Dewpoint ~6.5oC
As unsaturated air lifts dry adiabatically, it will eventually saturate: Normand’s Rule
Summary • Potential temperature – the temperature of air compressed/expanded to 1000 hPa along a dry adiabat • Pseudo-adiabatic charts – graphically solve equations • Skew T – ln p charts – will use in labs • Moist air – releases latent heat at saturation point • Saturated adiabatic lapse rate – less than DALR – typically 6 K/km • Normand’s Rule: Can estimate cloud base height using surface temperature and moisture