Download
1 / 12
120 likes | 131 Views
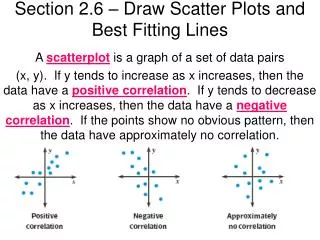
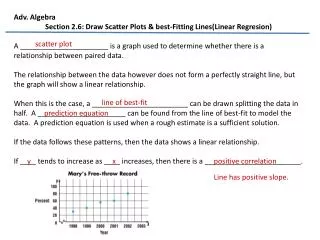
Correlation and Best-Fitting Lines. Scatter Plots. Positive Correlation If y tends to increase as x increases, then the paired data is said to have a positive correlation. Negative Correlation If y tends to decrease as x increases, then the paired data is said to have a negative correlation.

E N D
Scatter Plots • Positive Correlation If y tends to increase as x increases, then the paired data is said to have a positive correlation. • Negative Correlation If y tends to decrease as x increases, then the paired data is said to have a negative correlation.
Example • For each situation identify the correlation, positive, negative, or none. • 1) The age of a computer and the number of times it crashes. • 2) The number of trees on a property and the number of leaves on the ground. • 3) The height of a person and the number of books they read last year.
Correlation Coefficient • Denoted r • Tells us how closely data in a scatter plot fits a linear model. • The value of r is always between +1 and -1 Strength increases Strength increases -1 0 1
Describe the correlation describe the correlation: positive, negative or no correlation?
` • A few basic facts about r include: • The value of r ranges from -1 to 1 • Values of r close to 0 imply that there is little to no linear relationship between the data. • Values of r close to 1 imply there is a positive linear relationship between the data. This means that as x increases y also increases. • Values of r close to -1 imply that there is a negative linear relationship between the data. This means that as x increases that y decreases.
Remember: • The correlation coefficient only measures linear relationships. • A correlation greater than 0.7 is generally described as strong, whereas a correlation less than 0.5 is generally described as weak. • Therefore, a correlation of 0 does not mean zero relationship between two variables; rather, it means zero linear relationship. • It is possible for two variables to have zero linear relationship and a strong curvilinear relationship at the same time.
Correlation and Causation • Statements of correlation express a relation between two variables. • If a correlation exists between two variables, this does not necessarily mean that one variable causes the other. • One of the most common errors is the confusion between correlation and causation. • For example, eating breakfast has long been correlated with success in school. Is that true?
Correlation and Causation • Another example is “girls who watch soap operas are more likely to have eating disorders”- there have been many studies that incorrectly conclude that watching soap operas gives girls eating disorders. • In many cases, it seems obvious that one action causes the other. However, we must be careful and not jump to causal conclusions. • “a girl with an eating disorder” may suffer from a low self-esteem and poor body image, ie, anorexic.
Correlation and CausationDescribe the correlation and decide whether the correlation implies causation in this case. • Walking Speed May Predict Life Span Researchers who looked at data from nearly 35,000 senior citizens discovered that an elderly person’s walking speed is correlated to that person’s chance of living 10 more years. • For instance, the researchers found that only 19% of the slowest-walking 75-year old men lived for 10 more years compared with 87% of the fastest-walking 75-year old men. Similar results were found for elderly women.
Correlation and Causation • Work on page 149 and answer parts A and B