Download
1 / 6
60 likes | 441 Views
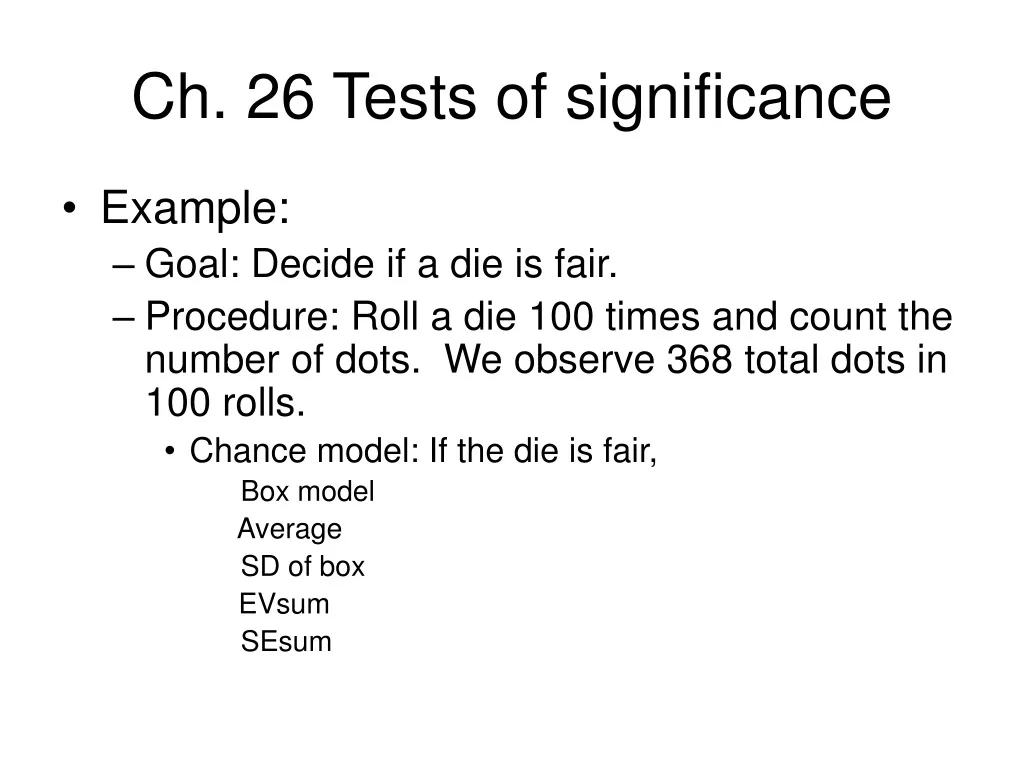
Ch. 26 Tests of significance. Example: Goal: Decide if a die is fair. Procedure: Roll a die 100 times and count the number of dots. We observe 368 total dots in 100 rolls. Chance model: If the die is fair, Box model Average SD of box EVsum SEsum.

E N D
Ch. 26 Tests of significance • Example: • Goal: Decide if a die is fair. • Procedure: Roll a die 100 times and count the number of dots. We observe 368 total dots in 100 rolls. • Chance model: If the die is fair, Box model Average SD of box EVsum SEsum
So we expect the total (sum of dots) to be around 350 give or take 17, or so. • What is the chance of observing a total of 368? z= The chance of getting results as extreme as 368 (or more) is
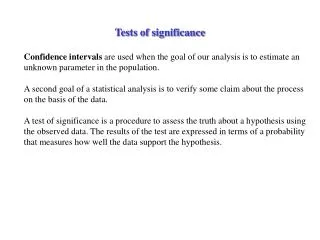
Same situation by 1000 rolls and observe a total of 3680. • Language: • Null hypothesis: Assume a specific chance process is at work (box model). • Alternative hypothesis: Another statement about the box. • Test statistic: Measures the difference between what is observed in the data and what is expected based on the null hypothesis.
In our example, • Null hypothesis: The die is fair. • Alternative hypothesis: The die is “loaded” so as to favor higher numbers. • P-value of a test = significance level • Probability/chance of getting a test statistic as extreme as, or more extreme than, the one based on observation.
Probability of observed result assuming the null hypothesis is true. (Not the probability that the alternative hypothesis is true.) • High p-value gives evidence supporting the null hypothesis. • Low p-value gives evidence against the null hypothesis. • Using z is appropriate for “large” samples and when the probability histogram is approximately normal.
Exercise C #7 p. 483 • A results is said to be statistically significant if the p-value is less than 5% and highly significant if the p-value is less than 1%.