Download
1 / 68
680 likes | 703 Views
Unveiling the historical eras of power planning in the PNW, this presentation explores the shifts from mysticism to economic determinism. It discusses the pivotal Fourth Era under the Northwest Power and Conservation Planning Act of 1980, emphasizing energy conservation as a cornerstone. Evaluating the effectiveness of the Act, it delves into the achievements in energy efficiency and resource planning, highlighting the region's strides towards a sustainable power system. Discover how energy efficiency initiatives have revolutionized utility planning, reduced costs, and shaped the energy landscape in the Pacific Northwest.

E N D
The Role of Energy Efficiencyin the Northwest Tom Eckman Manager, Conservation Resources Northwest Power and Conservation Council Presented October 20, 2005 to Maine Public Utilities Commission
The First Three “Eras” of Power Planning in the PNW • “New Deal” Mysticism (1930-1950) • Politicians plan using “chicken entrails and crystal balls” legislate what’s needed and when • Engineering Determinism (1950- 1970) • Engineers, using graph paper and rulers schedule the next power plants • Economic Determinism (1970 to April 27, 1983) • Economist, using price elasticity's slow the engineer’s construction schedules
Actions Taken in Response to “Engineering and Economic Determinist’s” Forecasts • Utilities planned and/or started construction on 28 coal and nuclear power plants to be completed over a 20-year period. • Native American tribes sued the state and federal government over loss of salmon • Environmental groups sued Bonneville Power Administration over plans to turn the Columbia River into “Wave World”
Impact of Actions Taken in Response to “Engineering and Economic Determinist’s Forecasts and Plans
Reaction to Impact of Actions Taken in Response to “Engineering and Economic Determinist’s Forecasts and Plans Terminate or mothball 9 nuclear and 5 coal plants at a cost to the region’s consumers of more than $7 billion. Motivate the region’s politicians, utilities, larger industries and public interest groups to accept the “deals” embodied in the Northwest Power and Conservation Planning Act of 1980
The Fourth Era -Northwest Power and Conservation Planning Act of 1980 (PL96-501) • Authorized States of ID, OR, MT and WA to form an “interstate compact” (aka, the “Council”) • Directed the Council to develop 20-year load forecast and resource plan (“The Plan”) and update it every 5 - years • To assure the region of an adequate, efficient and reliable power system • To provide for the development of the least cost mix of resources* • Conservation (energy efficiency) deemed highest priority resource equivalent to generation with a 10% cost advantage over power generating resources • Mandated public involvement in Council’s planning process. *Federally mandated “least cost integrated resource planning” on regional basis
Council Planning Process and Plans • Longest Running “Integrated Resource Planning Process” in the Country • Serves as “Regional Lens” through which state Commissions view utility IRPs (and other resource development) • Regional resource adequacy • Resource cost-effectiveness • Conservation/Efficiency goals
How Has It Worked? • Fundamentally changed utility resource planning • Council’s independent view of resource adequacy in first Plan led Bonneville and the region’s utilities terminate WNP 4&5, Skagit 1&2 and defer and ultimately cancel WNP 1&3, Creston 1&2, etc. • Oregon and Washington Commissions adopted “least-cost” planning requirements for investor-owned utilities, Idaho and Montana have since followed • First Council “Action Plan” Called on Bonneville and the Region’s Utilities to Develop Conservation to Reduce Year 2002 Loads by Between 5 – 17% • Let’s See How This Worked
How a PNW Kilowatt-Hour Gets Saved Northwest Power and Conservation Council The “Plan” Bonneville Power Administration Regional Technical Forum Public Utilities State Regulatory Commissions Northwest Energy Efficiency Alliance Investor Owned Utilities SBC Admn. Energy Trust of Oregon & NWEnergy (MT) = Rate Revenues Markets, Codes & Standards End Use Consumers = Policy = Policy Recommendations = Conservation Programs = Market Transformation Programs/Projects = Technical Recommendations = Program Funding
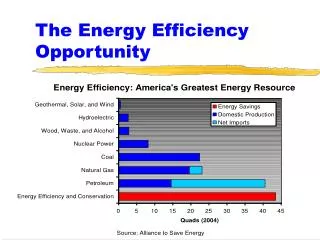
PNW Energy Efficiency Achievements1978 - 2004 Since 1978 Utility & BPA Programs, Energy Codes & Federal Efficiency Standards Have Produced Nearly 3000 aMW of Savings.
So What’s 3000 aMW? • It was enough electricity to serve the entire states of Maine and New Hampshire plus 50% of Vermont in 2004 • It Saved the PNW Region’s Consumers Nearly $1.25 billion in 2004
Energy Efficiency Resources Significantly Reduced Projected PNW Electricity Sales
Energy Efficiency Met Nearly 40% of PNW Regional Firm Sales Growth Between 1980 - 2003
Regional Utility Energy Efficiency Acquisitions Have Helped Balance Loads & Resources Creating Mr. Toad’s Wild Ride for the PNW’s Energy Efficiency Industry Response to West Coast Energy Crisis Response to NW Recession Response to “Restructuring Discussions”
5th Plan Relies on Conservation and Renewable Resources to of Meet Load Growth* *Actual future conditions (gas prices, CO2 control, conservation accomplishments) will change resource development schedule
Cost-Effective and Achievable Conservation Should Meet Over 45% of PNW Load Growth from 2005-2025* *Medium Load Forecast Loads & Market Prices
Regional Near-Term Conservation Targets (2005-2009) = 700 aMW
Why Should We?What’s Behind the 5th Plan’s Conservation Targets?
PNW Portfolio Planning – Scenario Analysis on Steroids FrequencyChart 1,000 Trials 1,000 Displayed .043 43 Portfolio Analysis Model .032 32.25 .022 21.5 .011 10.75 Mean = $689 .000 0 ($3,509) ($1,131) $1,247 $3,625 $6,003 Dollars NPV System Cost Efficient Frontier
Plans Along the Efficient Frontier Permit Trade-Offs of Costs Against Risk Least Cost Least Risk
Three Conservation Options Tested • Option 1: Accelerated – Similar to the “best performance” over the last 20 years • Non-lost opportunity limited to 120 aMW/year • Ramp-up lost-opportunity to 85% by 2017 • Option 2: Sustained - Similar to typical rates over last 20 years • Non-lost opportunity limited to 80 aMW/year • Ramp-up lost-opportunity to 85% by 2017 • Option 3: Status Quo - Similar to lowest rates over last 20 years • Non-lost opportunity limited to 40 aMW/year • Ramp-up lost-opportunity to 85% penetration by 2025
Average Annual Conservation Development for Alternative Levels of Deployment Tested
WECC Carbon Dioxide Emissions Reductions for Alternative Conservation Targets
Why Energy Efficiency Reduces System Cost and Risk • It’s A Cheap (avg. 2.4 cents/kWh TOTAL RESOURCE COST) Hedge Against Market Price Spikes • It has value even when market prices are low • It’s Not Subject to Fuel Price Risk • It’s Not Subject to Carbon Control Risk • It’s Significant Enough In Size to Delay “build decisions” on generation
The Plan’s Targets Are A Floor, Not a Ceiling When we took the “ramp rate” constraints off the portfolio model it developed 1500 aMW of Energy Efficiency in 2005
Plan Conservation Action Items • Ramp up “Lost Opportunity” conservation • Goal => 85% penetration in 12 years • 10 to 30 MWa/year 2005 through 2009 • Accelerate the acquisition of “Non-Lost Opportunity” resources • Return to acquisition levels of early 1990’s • Target 120 MWa/year next five years • Employ a mix of mechanisms • Local acquisition programs (utility, SBC Administrator & BPA programs) • Regional acquisition programs and coordination • Market transformation ventures
The Total Resource Acquisition Cost* of 5th Plan’s Conservation Targets2005 – 2009 = $1.64 billion *Incremental capital costs to install measure plus program administration costs estimated at 20% of capital.
PNW Utilities Now Invests Less Than 2% of Their Retail Sales Revenues in Energy Efficiency
Meeting the Plan’s Efficiency Targets Will Likely Require Increased Regional Investments
Although, The Share of Utility Revenues Required is Modest Regional Average Revenues/kWh will need to increase by $0.000006/kWh
Summary • The 5th Plan’s Goal IsTo Make The Inefficient Use of Electricity . . . • Immoral • Illegal • Unprofitable If We Fail Both Costs and Risk Will Be Higher
Total PNW Annual Energy Efficiency Achievements Have Been Growing, Largely Due To The Impact of Energy Codes and Standards
Maine’s Electric Sales 1,360 aMW in 2004 Source: US DOE/EIA
Maine Residential Electricity Use per Customer Declined in the 1990s… But Recently It’s Been Increasing
The Share of PNW Retail Electricity Sales Revenues Invested In Energy Efficiency Has Declined Since The Early 1990’s