Download
1 / 1
10 likes | 64 Views
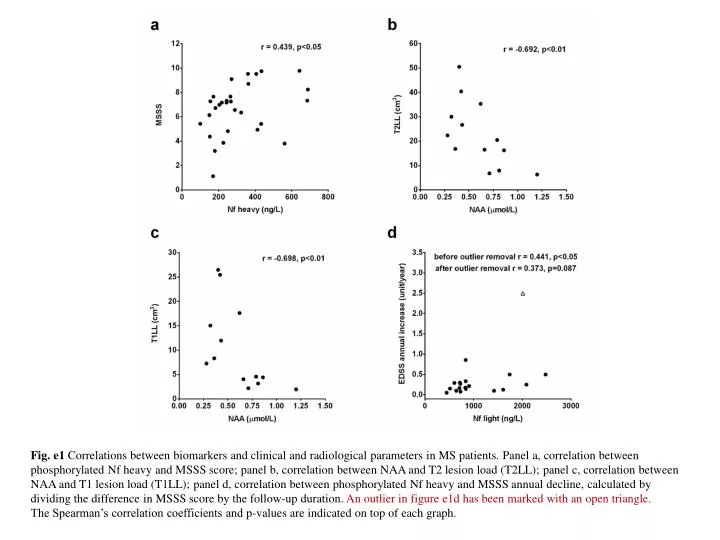
Explore relationships between phosphorylated Nf, NAA, and lesion loads with clinical and radiological parameters in MS. Significant correlations highlighted with Spearman’s coefficients and p-values.

E N D
Fig. e1 Correlations between biomarkers and clinical and radiological parameters in MS patients. Panel a, correlation between phosphorylated Nf heavy and MSSS score; panel b, correlation between NAA and T2 lesion load (T2LL); panel c, correlation between NAA and T1 lesion load (T1LL); panel d, correlation between phosphorylated Nf heavy and MSSS annual decline, calculated by dividing the difference in MSSS score by the follow-up duration. An outlier in figure e1d has been marked with an open triangle. The Spearman’s correlation coefficients and p-values are indicated on top of each graph.