Download
1 / 21
210 likes | 356 Views
Glaciers and Ice Sheets Interferometric Radar (GISIR) Center for Remote Sensing of Ice Sheets, University of Kansas, Lawrence, KS 66045. Introduction. Science Goals To measure surface and basal topography of terrestrial ice sheets To determine physical properties of glacier bed

E N D
Glaciers and Ice Sheets Interferometric Radar (GISIR) Center for Remote Sensing of Ice Sheets, University of Kansas, Lawrence, KS 66045
Introduction • Science Goals • To measure surface and basal topography of terrestrial ice sheets • To determine physical properties of glacier bed • Instrument • Radar: 150 MHz (20 MHz Bandwidth) & 450 MHz (50 MHz Bandwidth) • Multi-phase center antenna
Tasks List • Design and simulate radar with multiple receivers at 150 MHz and 450 MHz • Design and simulate the performance of antenna array for collecting multi-phase center data • Construct and evaluate radar performance in the laboratory with simulated targets • Integrate radar and navigational systems on an aircraft
Tasks List • Conduct field experiments • Conduct a field campaign to collect data • Process and distribute data • Analyze and synthesize results for presentation at conferences and publication in archival journals
Tasks Addressed • Design a new set of optimized antennas: We will build a model structure and measure its electrical performance • End-to-end simulation of the system, including antennas • Design and simulation of the radar
Prototype Multichannel Radar System • 6 Channel 140-160 MHz Radar System • Single Board Computer • 3 Compact PCI Carrier Cards • 1 Waveform Generator Card • 3 Dual Channel Data Acquisition Cards • 5 RF Modules
GISIR Radar System Block Diagram • Expandable from 1 to 8 Receivers • RF Subsystems Housed in Compact PCI Aluminum Modules • Very Similar to Existing Single Band MultiChannel Radar • High Power Switches Contained in external 2U 19” Rackmount Enclosure
16 bit 160 MHz Dual Channel Waveform Generator 2.9” • Used to create the chirped pulse input to the transmitter • Requires 120-MHz 0-dBm sine input • Generates 4-dBm output • 0.5 usec minimum pulse width • 60 usec maximum pulse width • Linear chirp from 10 - 50 MHz • Caltone from 0 - 50 MHz 5.9”
12 bit 170 MHz Dual Channel Data Acquisition Card 2.9” • Used to capture the return from the receiver • Requires 120-MHz 0-dBm sine input • 0-dBm full scale analog input • 72-dB dynamic range • 1 Megasample Input FIFO • Directly samples 140-160 MHz and 425-475 MHz return 5.9”
Compact PCI Carrier Card • Compact PCI interface • Holds two plug-on modules • Generates timing signals for waveform generator, data acquisition card, and RF module • Buffers captured data before transferring to the single board computer 9.2” 6.3”
Compact CPCI Carrier Card Block Diagram • Compact PCI interface • Reconfigurable FPGA Design • High Speed Plug-on Module Interface • 10 MHz Reference Input • Used to Implement Radar Timing Unit (RTU) 9.2” 6.3”
GPS Logging and Time Tagging • Everything Synchronized Off 10 MHz STALO • Implemented in CPCI Carrier FPGAs • 64 bit Radar Time Counter • Synchronizes GPS Time w/ Radar Time 9.2” 6.3”
GISIR Transmitter • Selectable Upconverter Stage • Single Sideband Mixer • Output Switch Routes TX and Cal Signals
GISIR Receiver • Calibration Tone Input Through 20 dB Coupler • Diplexer Input Filter • Selectable Receiver Gain (10 – 72 dB) • Selectable Output Filter Bank
GISIR Frequency Synthesizer • Generates 120 MHz and 420 MHz Clocks • Transmitter Upconverter Stage Los • Waveform Generator Clock • Data Acquisition Clocks
Antenna • Losses for back lobes radiation. • Non Uniform distribution for total gain. • Reduction – weakness at 45 and 135 degrees. • Nulls in the first and last 10 degree.
Antenna Return Loss • Acceptable return loss at the frequency of interest. • Evident mismatch impedance. • Decide the best matching network considering that at 150 or 450 MHz we should accept a mismatch.
Antenna VSWR • Acceptable voltage standing wave ratio VSWR. • Considered revised the model used for this simulation.
Antenna • The radiation pattern shows that we do not have an equivalent distribution of the energy. • At 45 and 135 degree the energy distribution is reduced at least -10 dB. • Two areas where a null could be verified: from 0 to 10 degrees and from 170 to 180 degrees. • In terms of the return loss and VSWR we can verify: • Between -8 to -9 dB as a reflection coefficient at the frequency of interest (450 MHz). • Between 428 to 435 MHz, the simulation gives the best response. Hence,. Since we are working with the same dipoles for 2 different frequencies, we might accept that in one of these frequencies our impedance will be mismatched. • Finally, as an overall conclusion, it is very important to reevaluate and design a matching network that minimizes the return loss and VSWR effects. Also, we estimate that according to these results we should continue simulating before we re-evaluate a different antenna solution.
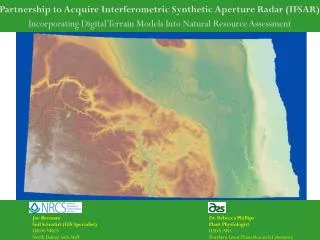
ACORDS Antenna array installation in the Chilean Navy P-3A Naval-408
Antennas • Two options • Leave it as is • 10-15 dB loss in S/N ratio • Redesign antennas • An AE student is looking into designing new dipoles • Two pieces • 450 MHz and 150 MHz • Telescoping design • Design will be done by the end of the summer 06