Download
1 / 10
100 likes | 183 Views
Energy Use and Pollution in Southern California. Energy and Pollution Management Are they necessary?. We live in a society with a mantra of progress. Development and use of energy to ease our lives and give us pleasure is good. Growth is good. Side effects:

E N D
Energy and Pollution ManagementAre they necessary? • We live in a society with a mantra of progress. • Development and use of energy to ease our lives and give us pleasure is good. • Growth is good. • Side effects: • Contaminants and waste pollute the environment. • Use of energy from stored vs. renewable sources depletes resources. • Growth is an amplifier. • Who wants to live in a dirty place without energy and other resources? Energy Use and Pollution in Southern California
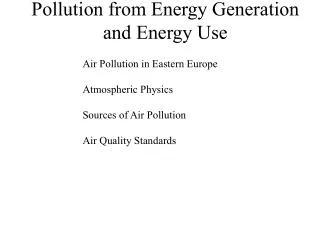
Air Pollution • Severity How bad was air pollution before cleanup started? (See panels 4 and 5.) • Improvement Awareness and legislation have resulted in great improvement. (Panel 6) • Current Status • Despite improvements over the years, the Los Angeles area remains the most ozone-polluted region in the country, according to a report released by the American Lung Association. (Los Angeles Daily News; Susan Abrams, Staff writer 04/29/2009 09:01:57 AM PDT) • State of the air: In 2011, Los Angeles was the most polluted U. S. city. (http://www.stateoftheair.org/2011/city-rankings/most-polluted-cities.html?gclid=CK3H-sCiu7ICFQWCQgodrEcAcA) • In 2012, the LA region remains the most severely polluted major urban air shed in the nation. It is the only region continuously classified by EPA as EXTREME in air pollution. Energy Use and Pollution in Southern California
LA Civic Center Masked by Smog06 January 1948 Courtesy UCLA Library Special Collections Energy Use and Pollution in Southern California
Reseda Smog Alert07 October 1965; Nancy Rayder, Jeffery La France Courtesy UCLA Library Special Collections Energy Use and Pollution in Southern California
Air Quality Has Improved25 August 2012 Bruce Chambers/Orange County Register/AP/File Traffic jams up on the eastbound 91 freeway near Corona, Calif., in this 2010 file photo. Although there are more cars on the highway in Los Angeles, the volume of smog-producing volatile organic compounds has fallen by half since 2002, thanks to 'greener' cars. Bruce Chambers/Orange County Register/AP/File Smog-producing compounds in Los Angeles are down 98 percent since the 1960s. They're down by half just since 2002 Energy Use and Pollution in Southern California
Sources of Air Pollution • Combustion of hydrocarbon fuels is the primary source of air pollutants in Los Angeles. • The principle polluters are transportation (cars, trucks, buses, planes, trains, ships), industry and power producers . • Primary pollutants are nitrogen oxides, gaseous hydro carbons, carbon monoxide, and large quantities of particulates. • In the presence of sunlight, nitrogen oxides combine with hydrocarbons to form a secondary class of pollutants, the photochemical oxidants, among them ozone and the eye-stinging peroxyacetylnitrate (PAN). • Nitrogen oxides also react with oxygen in the air to form nitrogen dioxide, a foul-smelling brown gas (smog). Energy Use and Pollution in Southern California
US Trends1970 – 2004; Growth Areas and Emissions TrendAmount • Gross Domestic Product Up 187% • Vehicle Miles Traveled Up 171% • Energy Consumption Up 047% • Population Up 040% • Aggregate Emissions Down 054% (Six Principle Pollutants) Source: EPA “Air Emissions Trends – Continued Progress through 2004,” http://www.epa.gov/airtrends/conom-emssions.html. Energy Use and Pollution in Southern California
US Energy Use (2010) Type Share • Automobile 32% • Light Trucks 28% • Other Trucks 16% • Aircraft 09% • Water 05% • Construction and Agriculture 04% • Pipeline 03% • Trains and Buses 03% Energy Use and Pollution in Southern California
California Energy Consumption In California, transportation energy consumption exceeds the other sectors. Energy Consumption in California by Sector, 2004 SectorAmountShare of U.S. Transportation 3,199,591 billion Btu 11.5% Industrial 2,052,670 billion Btu 6.1% Commercial 1,556,272 billion Btu 8.8% Residential 1,556,056 billion Btu 7.3% SOURCE: http://tonto.eia.doe.gov/state/state_energy_profiles.cfm?sid=CA November 16, 2007 Energy Use and Pollution in Southern California