Download

1 / 9
90 likes | 156 Views
Analyzing the impact of land zoning changes on households in Central Christchurch and Kaiapoi. Estimating net changes in household types and numbers, translating population effects into households and families. Data modeled at different geographic levels to provide detailed insights.

E N D
Residential Land Use Impact Indicators • e.g. Percent of land area zoned “red” or “orange” • Implied number of households vacated? Sum of (red) or discouraged (orange)? • Estimated net number of households lost • Meshblock level distribution of red and orange zone land units • Ward and Area Unit level summary
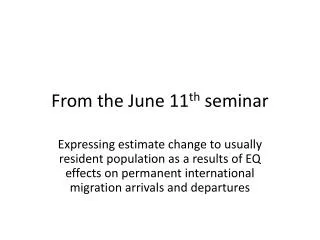
Translating Population effects into households and families …
Modelled loss or gain of households • e.g. Percent of land area zoned “red” or “orange” • Implied number of households vacated? Sum of (red) or discouraged (orange)? • Estimated net number of households lost • Meshblock level distribution of red and orange zone land units • Ward and Area Unit level summary
Estimated net change in Household Types in Christchurch City inferred from Statistics NZ population estimates
Estimated 2010 – 2011 change in occupied private households in Christchurch City by Area Unit
Estimated 2010 – 2011 change in number of occupied private households in Kaiapoi by Area Unit