Download
1 / 15
150 likes | 309 Views
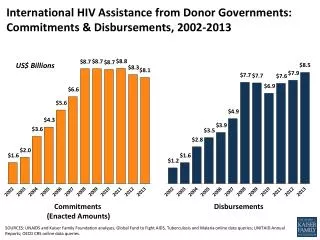
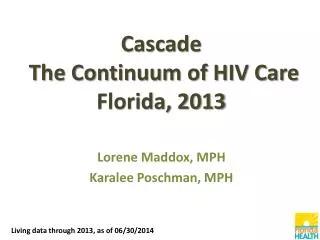
Cascade of HIV Care in the Netherlands from 2002 to 2013. Esther Engelhard 14th European AIDS Conference October 18, 2013. Disclosed no conflict of interest. 35.3 million. Cascade of care in the Netherlands Influence of hospital characteristics on cascade. 10.6 million. HIV infected.

E N D
Cascade of HIV Care in the Netherlands from 2002 to 2013. Esther Engelhard 14th European AIDS Conference October 18, 2013 Disclosed no conflict of interest.
35.3 million • Cascade of care in the Netherlands • Influence of hospital characteristics on cascade 10.6 million HIV infected Diagnosed Linked to care Retained in care On ART Virally suppressed
Background (1) HIV in the Netherlands • 17,006 HIV patients in clinical care • 1100 new patients in care in 2012
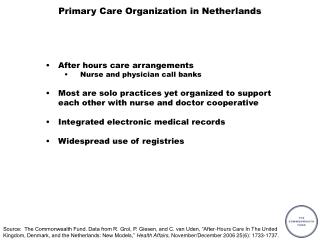
Background (2) HIV care • General health care: health insurance obligatory • 26 legally acknowledged HIV treatment centres • Standards determined by field experts • Criteria:
Q-HIV study Cascade of care • HIV care engagement in the Netherlands: 2002 - 2013 • Influence hospital characteristics: Centre size: number of patients in care Number of patients per HIV treating physician
Methods (1) Study population • HIV-1-infected patients, enrolled in 2002 or later • ≥18 years at time of HIV diagnosis • Alive and residing in the Netherlands Definitions • Linked to care: study population • Retained in care: evidence of being in care after Jan 1, 2012 • On ART: started with ART • Virally suppressed: <100 copies/mL
Methods (2) Stratification • Centre size: Small:≤500 patients in care. Large: >500 patients in care. • Patients per physician: ≤ 80 patients per physician 81-200 patients per physician >200 patients per physician
Overall Linked to care: 13,166 Retained in care: 93% Receiving ART: 79% Virally suppressed:70% Results (1)
Stratified by treatment centre size: No difference Results (2)
Stratified by no. of patients per physician: No difference Results (3)
Discussion (1) • Previously published data • Retained in Care: 56% - 68% • On cART: 41% - 50% • Virally suppressed: 32% - 38% • Our data: • 93%; 79%; 70%: relatively high • Possible explanations: • Accessibility health care access • Legal regulation of care; criteria HIV treatment centres; monitoring X X X Source: Mugavero et al, 2013
Discussion (2) 73% Challenges: • Diagnose HIV-infected population • Linkage to care diagnosed patients HIV Infected
Conclusions • Relatively high percentage of retention, ART use and viral suppression • No difference between small and large centres • (Early) diagnosis and linkage to care remain a challenge
Acknowledgements • Stichting HIV Monitoring • Ard van Sighem • Q-HIV study group: Frank Kroon Colette Smit Pythia Nieuwkerk Marlies Hulscher Peter Reiss Kees Brinkman Suzanne Geerlings • Aids Fonds