Download
1 / 29
300 likes | 509 Views
My Work at the German Aerospace Center pl: Niemieckie Centrum Badań Lotniczych i Kosmicznych de: D eutsches Zentrum für Luft- und Raumfahrt (DLR) Arthur Schady. Mission of DLR.

E N D
My Work at the German Aerospace Centerpl: Niemieckie Centrum Badań Lotniczych i Kosmicznychde: Deutsches Zentrum für Luft- und Raumfahrt (DLR)Arthur Schady
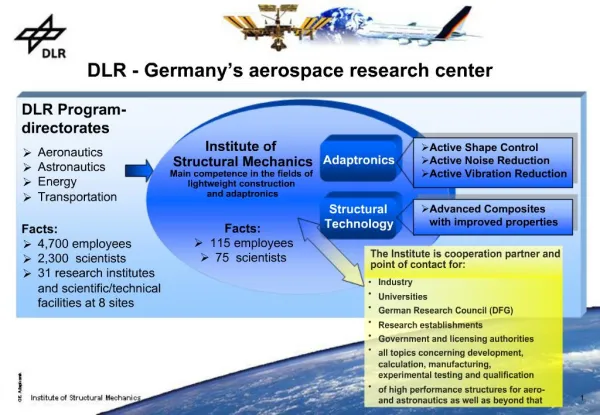
Mission of DLR To open up new dimensions for exploring the earth and the universe, for protecting the environment and for promoting mobility, communication and security: • Research portfolio ranging from basic research to innovative applications and the products of tomorrow • Operating large-scale research facilities for DLR’s own projects and as a service provider for its clients and partners • Promoting the next generation of scientists
European networking • Success in obtaining program funding from the European Union • Core formation in Europe for clearly defined strengthening of technical expertise and competitiveness • Expand the ability to determine the direction taken at European level
International networking • Orienting bilateral cooperation • Multilateral cooperation in determining the framework and marketing of DLR products • Further developing instruments of international cooperation
Transport • Resolving issues related to mobility, influencing and coping with the increase in transport • Energy saving, reducing pollutants that affect the climate and are harmful to the health and lowering noise emissions • Accident prevention, reducing the risks to people from accidents
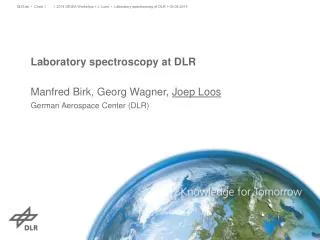
Visiting Scientist at DLR in Oberpfaffenhofen since 1.May 2006 My working fields: • NO2 related Data Analysis (http://www.pa.op.dlr.de/troccinox/) • Acoustic Modeling (http://www.pa.op.dlr.de/acoustics/)
NO2 related Data Analysis (TROCCINOX) • Satellite Data (SCIAMACHY) • Model Data (TM4) • Emission Data (EDGAR, MESSy, GEIA,…) • Deposition Data • Lightning Data (LIS/OTD) Number of Data sets: 6+2+6+1+9 = 24 Number of different formats: 9 Number of produced images: 724 - 981
NO2 related Data Analysis Satellite Data (SCIAMACHY)http://www.iup.physik.uni-bremen.de/sciamachy/ Observation of the Earth: Vertical Column of NO2 at 10:30 LT FORMAT: ASCII Dimensions: IM=440, JM=400, time=28 and 31 days , cloudy, clear Unit: molecules / cm² FORTRAN : preparing data for model comparison (grid average)
NO2 related Data Analysis Satellite Data (SCIAMACHY)http://www.iup.physik.uni-bremen.de/sciamachy/
NO2 related Data Analysis Model Data (TM4) http://www.knmi.nl/~velthove/tm.html Simulation of LNOx with different source rates 2Tg and 5Tg FORMAT: netCDF Dimensions: IM=120, JM=90, KM=30, time=28 and 30 days Unit: molecules / cm³ FORTRAN/CDO: vertical integration of 3D field; calculation of tropospherical NO2 4
4 NO2 related Data Analysis Model Data (TM4) http://www.knmi.nl/~velthove/tm.html
NO2 related Data AnalysisEmission Data (EDGAR, MESSy, GEIA,…)http://www.mnp.nl/edgar/http://www.messy-interface.org/http://www.geiacenter.org/ Analysis of different sources FORMATS: ASCII; netCDF; binary Dimensions: IM=360, JM=180, time= different years source categories (7 / 23) Unit: molecules / cm²/s …. FORTRAN/CDO: integration of the fields; time series …
NO2 related Data AnalysisEmission Data (EDGAR, MESSy, GEIA,…)
NO2 related Data Analysis Deposition Datahttp://www-eosdis.ornl.gov/cgi-bin/dataset_lister.pl?p=5Global Maps of Atmospheric Nitrogen Deposition, 1860, 1993, and 2050 Dentener, F. J. 2006. Global Maps of Atmospheric Nitrogen Deposition, 1860, 1993, and 2050. Data set. Available on-line [http://daac.ornl.gov/] from Oak Ridge National Laboratory Distributed Active Archive Center, Oak Ridge, Tennessee, U.S.A.Galloway, J. N., F. J. Dentener, D. G. Capone, E. W. Boyer, R. W. Howarth, S. P. Seitzinger, G. P. Asner, C. Cleveland, P. Green, E. Holland, D. M. Karl, A. F. Michaels, J. H. Porter, A. Townsend, and C. Vörösmarty. 2004. Nitrogen Cycles:ast, Present and Future. Biogeochemistry 70: 153-226.
NO2 related Data Analysis Deposition DataGlobal Maps of Atmospheric Nitrogen Deposition, 1860, 1993, and 2050
NO2 related Data Analysis Lightning Data (LIS/OTD)http://ghrc.msfc.nasa.gov/http://thunder.nsstc.nasa.gov/ OTD (Optical Transient Detector) + LIS (Lightning Imaging Sensor) FORMAT: HDF Dimensions: IM=720, JM=360, time= OTD-only window (5/95-11/97), the overlap window (12/97-4/00) and the LISonly window (12/97-present) Unit: flashes/s or flashes /km²/day IDL / FORTRAN : calculation for selected, regions, time LISOTD_HRFC_v1.0.hdfLISOTD_HRMC_V2.2.hdfLISOTD_LRACTS_v0.1.hdfLISOTD_LRADC_V2.2.hdfLISOTD_LRDC_v1.0.hdfLISOTD_LRDC_V2.2.hdfLISOTD_LRTS_V2.2.hdfLISOTD_LRMTS_V2.2.hdf
A380/A747 flights on 20 July and 23 August 2006- noise measurements -
source Wave front Wave lenght Pressure amplitude Sound ray Acoustics: sound waves Longitudinal Pressure oscillation = waveoscillation direction is parallel to propagation direction impulse → pressure oscillation - no flow From :www.bayern.de/lfu/laerm/l-ausst/laerm3.htm
Acoustics: Sound waves Attenuation sound amplitude decreas Refraction Diffraction Reflection
Acoustics: Sound propagation in the atmosphere temperature wind turbulence refraction scattering humidity absorption energy momentum mass sound field reflexion diffraction shadowing effects topography
Acoustics: Sound propagation model Aku3D (Heimann & Blumrich)