Download
1 / 66
660 likes | 832 Views
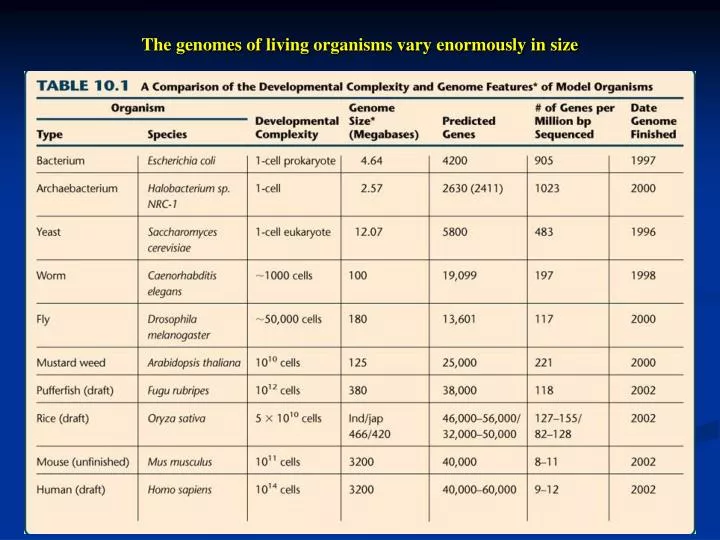
The genomes of living organisms vary enormously in size. Four classes of DNA polymorphisms. Single nucleotide polymorphism (SNP). Single base-pair substitutions Arise by mutagenic chemicals or mistakes in replication Biallelic – only two alleles 2001 – over 5 million human SNPs identified

E N D
Single nucleotide polymorphism (SNP) • Single base-pair substitutions • Arise by mutagenic chemicals or mistakes in replication • Biallelic – only two alleles • 2001 – over 5 million human SNPs identified • Most occur at anonymous loci • Useful as DNA markers
Microsatellites • 1 every 30,000 bp • Repeated units 2 – 5 bp in length • Mutate by replication error • Useful as highly polymorphic DNA markers Fig. 11.3
Minisatellites • Repeating units 20-100 bp long • Total length of 0.5 – 20 kb • 1 per 100,000 bp, or about 30,000 in whole genome Fig. 11.4
Deletions, duplications, and insertions • Expand or contract the length of nonrepetitive DNA • Small deletions and duplications arise by unequal crossing over • Small insertions can also be caused by transposable elements • Much less common than other polymorphisms
SNP detection using southern blots • Restriction fragment length polymorphisms (RFLPs) are size changes in fragments due to the loss or gain of a restriction site Fig. 11.6
SNP detection by PCR • Must know sequence on either side of polymorphism • Amplify fragment • Expose to restriction enzyme • Gel electrophoresis • e.g., sickle-cell genotyping with a PCR based protocol Fig. 11.7
SNP detection by ASO • Very short probes (<21 bp) that hybridize to one allele or other • Such probes are allele-specific oligonucleotides (ASOs) Fig. 11.8
ASOs can determine genotype at any SNP locus Fig. 11.9 a-c
Hybridized and labeled with ASO for allele 1 Hybridized and labeled with ASO for allele 2 Fig. 11.9 d, e
Preimplantation embryo diagnosis of CF using ASO analysis Fig. 11.1
High-throughput instrumentse.g, microarrays Fig. 10.24
Large-scale multiplex ASO analysis with microarrays can detect BRCA1 mutations • Each column contains an ASO differing only at the nucleotide position under analysis • BRCA1 DNA from any one allele can only be one of four ASOs in a column • Heterozygotes are easily deteted Fig. 11.10
Mass spectrometer Fig. 10.27
Microsatellite allele detectionanalysis of size differences Fig. 11.12
Huntington’s disease is an example of a microsatellite triplet repeat in a coding region Fig. 11.13
Minisatellite detection and DNA fingerprinting • 1985 – Alec Jeffreys made two key findings • Each minisatellite locus is highly polymorphic • Most minisatellites occur at multiple sites around the genome • DNA fingerprint – pattern of simultaneous genotypes at a group of unlinked loci • Use restriction enzymes and southern blots to detect length differences at minisatellite loci • Most useful minisatellites have 10 – 20 sites around genome and can be analyzed on one gel
Minisatellite analysis Fig. 11.14
DNA fingerprints can identify individuals and determine parentage • E.g., DNA fingerprints confirmed Dolly the sheep was cloned from an adult udder cell • Donor udder (U), cell culture from udder (C), Dolly’s blood cell DNA (D), and control sheep 1-12 Fig. 11.15
Human Karyotype • (a) complete set of human chromosomes stained with Giemsa dye shows bands • (b) Ideograms show idealized banding pattern Fig. 10.5 a
Chromosome 7 at three levels of resolution Fig. 10. 5 b
DNA hybridization and restriction mapping – a bottom-up approach Fig. 10.7
Identifying and isolating a set of overlapping fragments from a library • Two approaches • Linkage maps used to derive a physical map • set of markers less than 1 cM apart • Use markers to retrieve fragments from library by hybridization • Construct contigs – two or more partially overlapping cloned fragments • Chromosome walk by using ends of unconnected contigs to probe library for fragments in unmapped regions • Physical mapping techniques • Direct analysis of DNA • Overlapping clones aligned by restriction mapping • Sequence tag segments (STSs)
High density linkage mapping to build overlapping set of genomic clones Fig. 10.8
Physical mapping of overlapping genomic clones without linkage information Fig. 10.10
Physical mapping by analysis of STSs Fig. 10.11 Each STS represents a unique segment of the genome amplified by PCR.
Sequence maps show the order of nucleotides in a cloned piece of DNA • Two strategies for sequence human genome • Hierarchical shotgun approach • Whole-genome shotgun approach • Shotgun – randomly generated overlapping insert fragments • Fragments from BACs • Fragments from shearing whole genome • Shearing DNA with sonication • Partial digestion with restriction enzymes
Hierarchical shotgun strategyUsed in publicly funded effort to sequence human genome • Shear 200 kb BAC clone into ~2 kb fragments • Sequence ends 10 times • Need about 1700 plasmid inserts per BAC and about 20,000 BACs to cover genome • Data from linkage and physical maps used to assemble sequence maps of chromosomes • Significant work to create libraries of each BAC and physically map BAC clones Fig. 10.12
Whole-genome shotgun sequencingPrivate company Celera used to sequence whole human genome • Whole genome randomly sheared three times • Plasmid library constructed with ~ 2kb inserts • Plasmid library with ~10 kb inserts • BAC library with ~ 200 kb inserts • Computer program assembles sequences into chromosomes • No physical map construction • Only one BAC library • Overcomes problems of repeat sequences Fig. 10.13
Sequencing of the human genome • Most of draft took place during last year of project • Intruments improvements – 345,600 bp/day • Automated factory-like production line generated sufficient DNA to supply sequencers on a daily basis • Large sequencing centers with 100-300 instruments – 103,680,000 bp/day (10-fold coverage in 30 days)
High-throughput DNA sequencing Fig. 10.23
Integration of linkage, physical, and sequence maps • Provides check on the correct order of each map against other two • SSR and SNP DNA linkage markers readily integrated into physical map by PCR analysis across insert clones in physical map • SSR, SNP (linkage maps), and STS markers (physical maps) have unique sequences 20 bp or more allowing placement on sequence map
Cloning human genes A pedigree of the royal family descended from Queen Victoria In which hemophilia A is segregating Fig. 11.16 a
Blood-clotting cascade in which vessel damage causes a cascade of inactive factors to be converted to active factors Fig. 11.16 b
Blood tests determine if active form of each factor in the cascade is present Fig. 11.16 c
Techniques used to purify Factor VIII and clone the gene Fig. 11.16 d
Positional Cloning – Step 1 • Find extended families in which disease is segregating • Use panel of polymorphic markers spaced at 10 cM intervals across all chromosomes • About 300 markers total • Determine genotype for all individuals in families for each DNA marker • Look for linkage between a marker and disease phenotype
Once region of chromosome is identified, a high resolution mapping is performed with additional markers to narrow down region where gene may lie Fig. 11.17