Download
1 / 3
30 likes | 138 Views
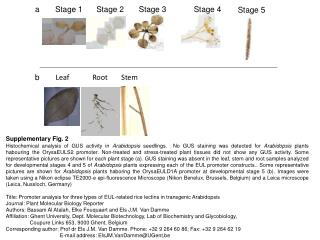
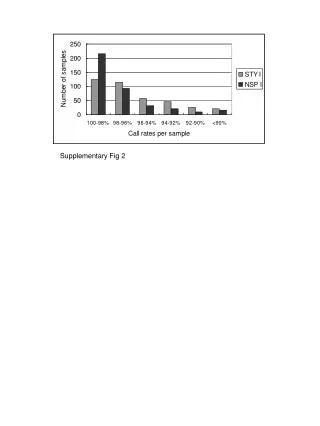
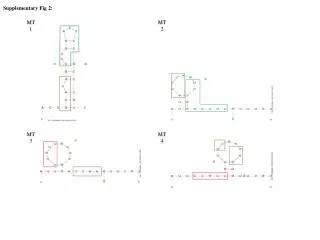
Supplementary Fig. 2. Statistical Classification Analysis Results. Box and whisker plots displaying mean performance metrics returned in the assessment of in vitro AC 50 values and dosimetry-adjusted oral equivalent values in the prediction of the 28 continuous in vivo toxicity endpoints.

E N D
Supplementary Fig. 2. Statistical Classification Analysis Results. Box and whisker plots displaying mean performance metrics returned in the assessment of in vitro AC50 values and dosimetry-adjusted oral equivalent values in the prediction of the 28 continuous in vivo toxicity endpoints. Metrics assessed: mean absolute error and root mean squared error (RMSE) Forty SAS statistical classification models were used.* Detailed descriptions and parameters of the SAS models are provided in Supplementary Table 8; full names for the in vivo endpoints are provided in Supplementary Table 7.
In Vitro Oral Equivalent Dose – Continuous In Vivo Response Data (LEL) In Vitro Nominal AC50 and LEC Concentrations – Continuous In Vivo Response Data (LEL) Fig. 8
In Vitro Oral Equivalent Dose – Continuous In Vivo Response Data (LEL) In Vitro Nominal AC50 and LEC Concentrations – Continuous In Vivo Response Data (LEL) Fig. 8