Download
1 / 39
390 likes | 532 Views
CHAPTER 1 BLOOD AND MARROW TRANSPLANTATION. Editors : Dr Alan Teh Kee Hean Prof Dr Chan Lee Lee Expert Panel: Dr Alan Teh Kee Hean (co-chairperson) Prof Dr Chan Lee Lee (co-chairperson) Prof Dr Gan Gin Gin Dr Hishamshah Mohd Ibrahim Prof Dr S. Fadilah Abdul Wahid Dr Ong Tee Chuan.

E N D
CHAPTER 1BLOOD AND MARROW TRANSPLANTATION Editors: Dr Alan Teh Kee Hean Prof Dr Chan Lee Lee Expert Panel: Dr Alan Teh Kee Hean (co-chairperson) Prof Dr Chan Lee Lee (co-chairperson) Prof Dr Gan Gin Gin Dr Hishamshah Mohd Ibrahim Prof Dr S. Fadilah Abdul Wahid Dr Ong Tee Chuan
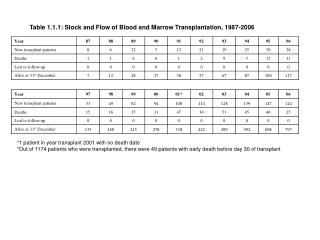
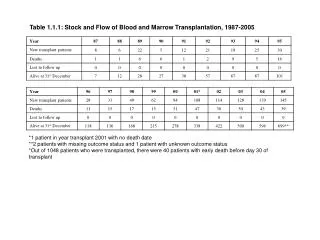
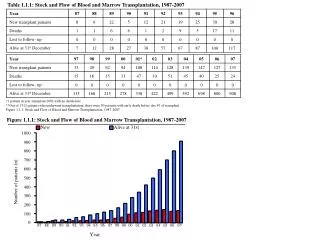
New patients Alive at 31st Dec 1,000 800 600 Number of patients (n) 400 200 0 87 88 89 90 91 92 93 94 95 96 97 98 99 00 01 02 03 04 05 06 07 08 Year Table 1.1.1: Stock and Flow of Blood and Marrow Transplantation, 1987-2008 Figure 1.1.1: Stock and Flow of Blood and Marrow Transplantation, 1987-2008
7 6 5 4 New Tranplant rate pmp 3 2 1 0 87 88 89 90 91 92 93 94 95 96 97 98 99 00 01 02 03 04 05 06 07 08 Year Table 1.1.2: New Transplant Rate per million population (pmp), 1987-2008 Figure 1.1.2: New Transplant Rate per million population (pmp), 1987-2008
Table 1.1.3: Distribution of Patients by Transplant Centre, 1987-2008
Table 1.1.3: Distribution of Patients by Transplant Centre, 1987-2008
KLA GMC KLP LWE UKM SJA SJP UMA HUSM UMP ASH HA HPP Others 140 100 120 90 80 100 70 80 60 Number of patients (n) Number of patients (n) 50 60 40 40 30 20 20 10 0 0 87 87 88 88 89 89 90 90 91 91 92 92 93 93 94 94 95 95 96 96 97 97 98 98 99 99 00 00 01 01 02 02 03 03 04 04 05 05 06 06 07 07 08 08 Year Year Figure 1.1.3: Distribution of Patients by Centre, 1987-2008
Male Female 100 90 80 70 60 Percentage of patients (%) 50 40 30 20 10 0 87 88 89 90 91 92 93 94 95 96 97 98 99 00 01 02 03 04 05 06 07 08 Year Table 1.2.1: Distribution of Patients by Gender, 1987-2008 Figure 1.2.1: Distribution of Patients by Gender, 1987-2008
Table 1.2.2: Distribution of Patients by Ethnic Group, 1987-2008
Malay Chinese Indian Bumiputera Sabah Bumiputera Sarawak Others 100 90 80 70 60 Percentage of patients (%) 50 40 30 20 10 0 87 88 89 90 91 92 93 94 95 96 97 98 99 00 01 02 03 04 05 06 07 08 Year Figure 1.2.2: Distribution of Patients by Ethnic Group, 1987-2008
Table 1.2.3: Distribution of Patients by Age Group, 1987-2008
0-9 years 10-19 years 20-39 years 40-59 years ≥60 years 100 90 80 70 60 Percentage of patients (%) 50 40 30 20 10 0 87 88 89 90 91 92 93 94 95 96 97 98 99 00 01 02 03 04 05 06 07 08 Year Figure 1.2.3: Distribution of Patients by Age Group, 1987-2008
Table 1.2.4: Distribution of Patients by Primary Diagnosis, 1987-2008
Table 1.3.1: Distribution of Patients by Graft Number, 1987-2008 • Note: Missing in graft number = 71 patients (5%)
Graft number 1 Graft number 2 Graft number 3 100 80 60 Percentage of patients (%) 40 20 0 87 88 89 90 91 92 93 94 95 96 97 98 99 00 01 02 03 04 05 06 07 08 Year Figure 1.3.1: Distribution of Patients by Graft Number, 1987-2008
Table 1.3.2: Distribution of Patients by Transplantation Type, 1987-2008
Allogeneic+Syngeneic Autologous 180 160 140 120 100 Number of patients (n) 80 60 40 20 0 87 88 89 90 91 92 93 94 95 96 97 98 99 00 01 02 03 04 05 06 07 08 Year Figure 1.3.2: Distribution of Patients by Transplantation Type, 1987-2008
Allogeneic+Syngeneic Autologous 300 250 200 Number of patients (n) 150 100 50 0 KLA KLP UKM SJA UMA UMP GMC LWE SJP HUSM ASH HA HPP Other Centre Table 1.3.3: Type of Transplant by Centre, 1987-2008 Figure 1.3.3: Type of Transplant by Centre, 1987-2008
Marrow PBSC/ Marrow+ PBSC Cord blood/ Marrow + cord 180 160 140 120 100 Number of patients (n) 80 60 40 20 0 87 88 89 90 91 92 93 94 95 96 97 98 99 00 01 02 03 04 05 06 07 08 Year Figure 1.3.4: Source of Stem Cells, 1987-2008
Table 1.3.5: Distribution of Patients by HLA Match, 1987-2008
Table 1.3.6: Distribution of Patients by Allogeneic Donor Relationship, 1987-2008
Table 1.4.1: Distribution of Patients by Cause of Death, 1987-2008
Table 1.4.1: Distribution of Patients by Cause of Death, 1987-2008
Figure 1.4.1: Patient Survival by Year of Transplant, 1987-2008 Figure 1.4.2: Patient Survival by Gender, 1987-2008
1.00 0.75 0.50 Cumulative survival 0.25 0.00 0 1 2 3 4 5 6 7 8 9 10 11 12 13 14 15 16 17 18 19 20 Duration in years 0-9 years 10-19 years 20-39 years ≥40 years Figure 1.4.3: Patient Survival by Age Group, 1987-2008 Figure 1.4.4: Patient Survival by Type of Transplant, 1987-2008
Figure 1.5.1: Disease-free Survival for Acute Myeloid Leukaemia, 1987-2008 (Allogeneic vs. Autologous)
Figure 1.5.2: Disease-free Survival for Acute Lymphoblastic Leukaemia, 1987-2008 (Allogeneic)
Figure 1.5.3: Disease-free Survival for Thalassaemia, 1987-2008 (Allogeneic)
Figure 1.5.4: Disease-free Survival for Non-Hodgkin’s Lymphoma, 1987-2008 (Allogeneic vs. Autologous)
Figure 1.5.5: Disease-free Survival for Hodgkin’s Disease, 1987-2008 (Autologous)
Figure 1.5.6: Disease-free Survival for Chronic Myeloid Leukaemia, 1987-2008 (Allogeneic)
Figure 1.5.7: Disease-free Survival for AplasticAnaemia, 1987-2008 (Allogeneic)
Figure 1.5.8: Disease-free Survival by Age Group for Acute Myeloid Leukaemia, 1987-2008 • Pediatric is defined as age 18 years and adult age >18 years .
Figure 1.5.9: Disease-free Survival by Age Group for Acute Lymphoblastic Leukaemia, 1987-2008 • Pediatric is defined as age 18 years and adult age >18 years .
Figure 1.5.10: Disease-free Survival by Age Group for Thalassaemia, 1987-2008
Figure 1.5.11: Disease-free Survival by Age Group for Non-Hodgkin’s Lymphoma, 1987-2008 • Pediatric is defined as age 18 years and adult age >18 years .
Figure 1.5.12: Disease-free Survival by Age Group for Hodgkin’s Disease, 1987-2008 • Pediatric is defined as age 18 years and adult age >18 years .
Figure 1.5.13: Disease-free Survival by Age Group for Chronic Myeloid Leukaemia, 1987-2008
Figure 1.5.14: Disease-free Survival by Age Group for AplasticAnaemia, 1987-2008 • Pediatric is defined as age 18 years and adult age >18 years .