Download
1 / 32
340 likes | 728 Views
Decision Making in Child Protection. The Overlap of Welfare, CPS and Foster Care. Welfare Families . Families served by CPS. Foster Care. Child welfare and welfare. Frame (1998) 25% of children in new welfare cases in California had history of involvement with child welfare system.

E N D
The Overlap of Welfare, CPS and Foster Care Welfare Families Families served by CPS Foster Care
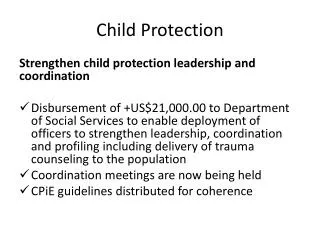
Child welfare and welfare Frame (1998) 25% of children in new welfare cases in California had history of involvement with child welfare system. Shook (1999) 40% of children in foster care were on welfare the month before placement. Another 20% on welfare in previous months. Palmer, Rogers, Digre, & Williams (1997) 70% of child welfare families receiving welfare.
Children new to foster care from welfare families: California 90% Illinois 85% North Carolina 90% Source: Needell, Cucaro-Alamin, Brookhard, and Lee (1999)
Foster Care in Los Angeles 97% of foster care children in Los Angeles come from homes below the poverty line Source: Los Angeles Times (1999)
Neglect, Abuse and Child Protection Child Abuse and the Law
Effectiveness of the Child Protection System Key: The decision to remove a child
The Placement Decision:reliabilityfactors which influence: discriminant analysis odds ratio models
Incidence of Child Abuse Fatalities by Income Source: National Incidence Study-3, 1996.
Family Income and Incidence of Death and Serious Injury from Child Abuse
State comparisons of types of neglect and abuse, 2000Based on data from the National Child Abuse and Neglect Data System (NCANDS, 2002) and Child and Family Services Review (CFSR, 2003).
Percent of Substantiated Reports that were Emotional Abuse Source: Child Welfare Outcome (2003).
Percent of Substantiated Reports that were Neglect National Average = 69 % Source: Child Welfare Outcome (2003); NCANDS (2003).
Percent of Substantiated Reports that were Physical Abuse . National Average = 19 %
Percent of Substantiated Reports that were Sexual Abuse . National Average = 10 %
Why such variation?On such a sensitive matter is this type of variation acceptable?Is the identification of child abuse more art than science? .
What is the incidence of various types of abuse?Does it vary much by state?Let’s look at the rate of various types of substantiated abuse per 10,000 children in the state. .
Rate of substantiated Emotional Abuse per 10,000 children . Source: Child Welfare Outcome (2003).
Rate of substantiated Neglect per 10,000 children . Source: Child Welfare Outcome (2003).
Precision of the Diagnostic Assessment Or is it a judicial judgment? Or simply a social worker’s assessment? Perhaps the question is: What are the consequences of an error in assessment? No one’s life is at risk except the children we wish to protect. The primary goal has to be the protection of children. But is there a limit?
We began with the question:the decision to remove A substantiated finding of “neglect” or “physical abuse” or “sexual abuse” can lead to removal of the child from the home. In fact, the main task of the investigation is to determine whether to remove the child.
Terminating Parental Rights (TPR) in 2000 Source: Adoption and Foster Care Analysis Reporting System (AFCARS), April, 2003.