Download
1 / 19
190 likes | 325 Views
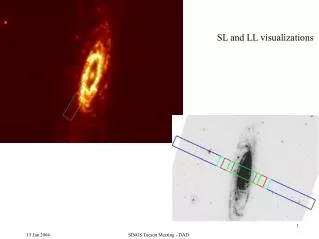
MAPS AND VISUALIZATIONS. Cartography: The art, science, and techniques of making maps or charts. Two types of GIS output: Maps Digital or analog (hard-copy) output from a GIS that shows geographic information using well-established cartographic conventions. Visualizations

E N D
Cartography: The art, science, and techniques of making maps or charts. • Two types of GIS output: • Maps • Digital or analog (hard-copy) output from a GIS that shows geographic information using well-established cartographic conventions. • Visualizations • An interface to digitally display, analyze, edit, and query geographic information.
Two Basic Map Types • Reference Maps:
Two Basic Map Types Thematic Maps:
Maps are good for: • Storage of Spatial Data • Communication of Spatial Information • Creating and or Reinforcing a Particular Message • Limitations: • Can Miscommunicate(accidentally or on purpose) • Single realization of a spatial process • Complex rules, symbology, conventions
Some Constraints Inherentin Paper Maps • Fixed Scale • Fixed Extent • Static View • 2-dimensional
Principles of Map Design • Primary Goals: • Share information • Highlight patterns and processes • Illustrate Results • Secondary Objective: • Create a pleasing and interesting picture
7 Controls of the Map Design Process • Purpose • Reality • Available Data • Map Scale • Audience • Conditions of Use • Technical Limits
Map Composition • Map Elements • Map Body • Inset (Overview) Map • Title • Legend • Scale • Direction Indicator • Map Metadata • Layout should have good visual balance
Inset map Scale Author North Arrow Data Source Map Body Projection Legend Grid Title
Map Symbolization • Data is Classified and Represented using graphic symbols and colors that conform to well-defined conventions.
Attribute Representation • Symbols representing attributes are classified in various ways to communicate different types of information • Four basic classification schemes: • Natural Breaks (Jenks) • Quantile Breaks • Equal Interval Breaks • Standard Deviation Classifications
Natural Breaks (Jenks) • Class breaks conform to gaps in data distribution. Minimizes variation within classes, and maximizes variation between classes.
Quantile • Equal number of observations within each class. Class intervals can be significantly different in size with this classification.
Equal Interval • Equal distance between class breaks. The range of value that the class represents is the same for all classes.
Standard Deviation • Class breaks based on a distance of standard deviation from the mean. Useful if data is distributed along a normal curve.