Download
1 / 29
290 likes | 411 Views
GENERATION OF PARAMETRIC IMAGES. PROSPECTS PROBLEMS. Vesa Oikonen Turku PET Centre 2004-03-25. Multiple-Time Graphical Analysis. Gjedde-Patlak plot for irreversible uptake Logan plot for reversible uptake Independent on model structure Plasma and reference tissue input Fast computation

E N D
GENERATION OF PARAMETRIC IMAGES • PROSPECTS • PROBLEMS Vesa Oikonen Turku PET Centre 2004-03-25
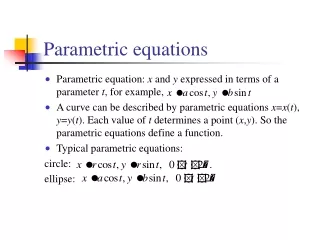
Multiple-Time Graphical Analysis • Gjedde-Patlak plot for irreversible uptake • Logan plot for reversible uptake • Independent on model structure • Plasma and reference tissue input • Fast computation • Available everywhere
Multiple-Time Graphical Analysis • Regional analysis to determine the time when plot becomes linear • For Logan analysis with reference tissue input: compartment model fit to determine population average of reference tissue k2
Multiple-Time Graphical Analysis • Examples of DV and DVR images
Multiple-Time Graphical Analysis • Different regions have different kinetics • Usually linear phase is reached later in regions of high uptake • Solution: select fit range separately for each pixel
Multiple-Time Graphical Analysis DVR image where fit range was determined separately for each pixel Nr of frames used in line fit(darker=more frames
Compartmental model fit • Also time before equilibrium is used in the fit • Parametersare solvedfrommultilinearequations
Compartmental model fit • Fast computation from multilinear equations with standard techniques • Multilinear equations can be transformed to solve macroparameters (DV or Ki) without division
Compartmental model fit • Pixel-by-pixel selection between 2CM and 3CM based on Akaike Information Criteria (AIC), or • Akaike weighted average of DV from 2CM and 3CM fits (Turkheimer et al 2003)
Compartmental model fit Relative weights of2CM (white) and 3CM (black)based on AIC Akaike weighted average ofDV from 2CM and 3CM
Compartmental model fit • Alternative to Akaike weighting:Lawson-Hanson non-negative least-squares (NNLS) produces good-quality DV and DVR images from multilinear 3CM
Simplified Reference Tissue Method (SRTM) • Basis Function Method (BFM) • Multilinear equations Binding Potential (BP) solved using
SRTM-BFM • Parameter bounds must be determined based on regional analysis • Tight bounds cause poor fit and bias in some regions • Wide bounds may lead to long-tailed BP distribution and positive bias
SRTM-NNLS • Multilinear equation can be transformed to solve BP+1 without division • Provides good-quality BP images when NNLS is used
SRTM-NNLS BP image calculatedusing SRTM-NNLS
Parametric sinogram • Faster ( iterative ) reconstruction • Intrinsic ”heterogeneity” • All linear models applicable
Parametric sinogram DVR sinogram DVR imageFBP reconstruction
Calculation on sinogram level • Correct for physical decay • Correct for frame lengths • Model calculation as usual • Reconstruction • Divide pixel values by volume (if not done in reconstruction or calibration) • Calibration (only with plasma input, and not even then for all parameters) • Calculations with parameters after reconstruction
Parametric sinogram: problems • Multiple-Time Graphical Analysis: when linear phase starts? • Multilinear equations: which model? • Reference input TAC: pre-reconstruction needed
Parametric sinogram:more problems • Dynamic sinogram must be filtered before calculation; avoid another filtering in reconstruction! • Requires full knowledge on raw data collection and processing steps
Parametric sinogram • In future:Iterative reconstruction and model calculation combined
PROBLEMS • Noise induses bias in all linear methods for reversible uptake • Logan plot: no satisfactory method for removing bias • Multilinear methods: GLLS can not be applied to reference tissue models
More problems • SRTM can not be used for all tracers • Weights for fitting are not known • Partial volume error (PVE)may lead to artefactual second tissue compartment in reference region
More problems • Movement during scanning DVR image without movement and after moving 3 frames 4 mm (2 pxls) upward
Movement during scanning • Complicated models are more sensitive to movement Same simulation, but Logan plot computed with variable line fit start time
Image filtering • Only working method to reduce bias in linear models • Resolution need not to be preserved if next analysis step is SPM or other brain averaging method • Biases may be cancelled out in calculation of occupancy maps
Cluster analysis • Resolution preserving smoothing for dynamic images • Automatic extraction of reference tissue curve • Extraction of curves with different kinetics: Validation that selected model can fit them all
CONCLUSION • Problems: image noise, patient movement and inconsistent input data • Until solved, use only simple models causing biases but less artefacts • Validation in animal models and in vitro is essential