Download
1 / 22
220 likes | 312 Views
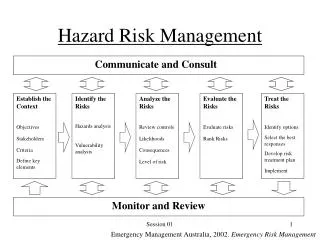
Putting people and risk in the same picture via hazard ensemble diagrams Tim Lutz Dept. of Geology & Astronomy West Chester University West Chester, PA tlutz@wcupa.edu. GSA’s position statement on Natural Hazards (2008) :

E N D
Putting people and risk in the same picture via hazard ensemble diagrams Tim Lutz Dept. of Geology & Astronomy West Chester University West Chester, PA tlutz@wcupa.edu
GSA’s position statement on Natural Hazards (2008): “Geoscientists have a professional responsibility to inform the public about natural hazards and the need to build an increasingly natural hazard-resilient society, thereby enabling more responsible actions and decisions.” National Research Council’s report on flood risk reduction (2000): “Identifying sound, credible, and effective risk reduction priorities and solutions depends greatly on a well-informed public. The public should be knowledgeable about risk issues and should be given opportunities to express opinions and become involved in risk assessment and risk management activities.”
National Flood Insurance Program (NFIP) Flood Insurance Rate Map (FIRM)
Mean = median = mode = 100 years Default concept: Probability decreases symmetrically around the mean
Mode = 0 years Recurrence interval distribution predicted for independent random events (exponential distribution) Standard deviation = Mean (e.g., 100 years ± 100 years) Median = 69 years Mean = 100 years
Five series of random events; average recurrence = 100 years Series 1 Series 2 Series 3 Series 4 Series 5
Five series of random events; average recurrence = 100 years Series 1 Series 2 Series 3 Series 4 Series 5
Example: USGS 05331000 Mississippi River @ St Paul, MN (114 years of record) Twin Cities 7 Metro map.png by Davumaya (2008), provided by Wikimedia
The inverse of a magnitude-exceedance probability model can be used to simulate annual peak flows
An ensemble is a set of simulations which together define the distribution of most probable outcomes conditional on exposure.
Unwarranted pessimism Weighing of risks Unwarranted optimism
Top of right bank levee in S. St. Paul (29 ft) Flood walls deployed at St. Paul airport (17 ft) Flood stage (14 ft)
Annual peak flow history Magnitude-frequency model Magnitude-frequency model Flow ensemble
Flow ensemble Stage ensemble + Rating model =
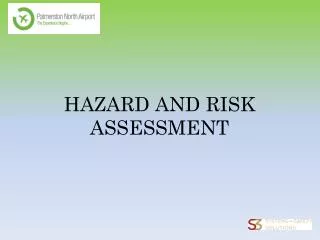
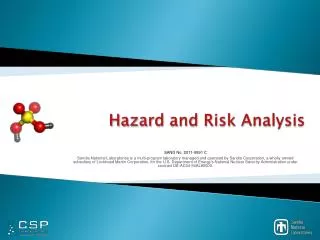
Generalization • History of hazard Magnitude-frequency model Ensemble diagrams • Straightforward extensions • Seismic hazard Gutenberg-Richter model Ensemble diagrams • Volcanic hazard VEI1-based m-f model Ensemble diagrams • Nuclear hazards INES2-based m-f model Ensemble diagrams 1 VEI = Volcano Explosivity Index 2 INES = International Nuclear & Radiological Event Scale
For more information about hazard ensemble diagrams, check out Lutz, 2011, JGE v. 59, pp. 5-12; and email me (tlutz@wcupa.edu) for an Excel file that can generate ensembles from annual peak flow data.