Download
1 / 22
250 likes | 1.66k Views
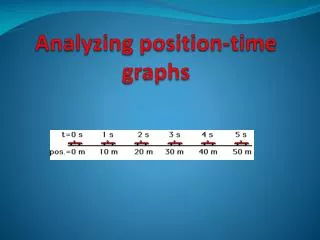
Explore different position-vs-time graphs depicting accelerated motion, uniform motion, and changing velocity over time intervals with various scenarios. Learn about slope changes indicating velocity adjustments and intervals representing positive or negative directions. Study acceleration, velocity, and time relationships through graphical representations.

E N D
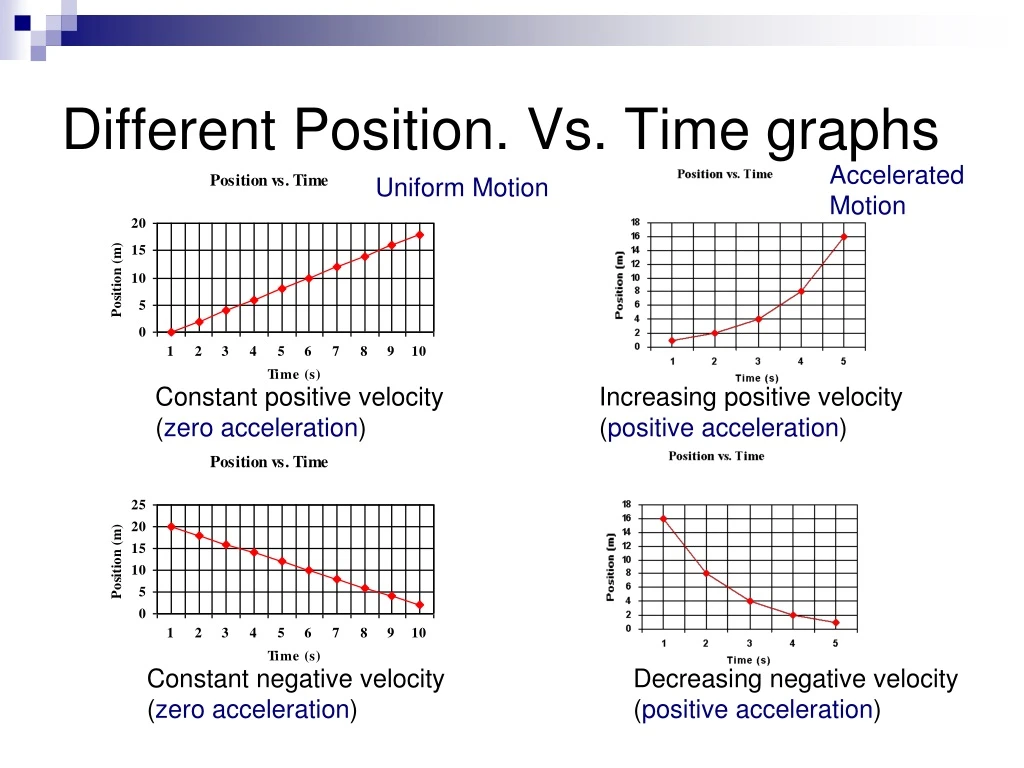
Different Position. Vs. Time graphs Accelerated Motion Uniform Motion Constant positive velocity (zero acceleration) Increasing positive velocity (positive acceleration) Constant negative velocity (zero acceleration) Decreasing negative velocity (positive acceleration)
Different Position. Vs. Time Changing slope means changing velocity!!!!!! Increasing negative slope = ?? Decreasing negative slope = ??
x B A t C A … Starts at home (origin) and goes forward slowly B … Not moving (position remains constant as time progresses) C … Turns around and goes in the other direction quickly, passing up home
During which intervals was he traveling in a positive direction? During which intervals was he traveling in a negative direction? During which interval was he resting in a negative location? During which interval was he resting in a positive location? During which two intervals did he travel at the same speed? A) 0 to 2 sec B) 2 to 5 sec C) 5 to 6 sec D)6 to 7 sec E) 7 to 9 sec F)9 to 11 sec
x C B t A D Graphing w/ Acceleration A … Start from rest south of home; increase speed gradually B … Pass home; gradually slow to a stop (still moving north) C … Turn around; gradually speed back up again heading south D … Continue heading south; gradually slow to a stop near the starting point
x Tangent Lines t On a position vs. time graph:
x t Increasing & Decreasing Increasing Decreasing On a position vs. time graph: Increasing means moving forward (positive direction). Decreasing means moving backwards (negative direction).
x t Concavity On a position vs. time graph: Concave up means positive acceleration. Concave down means negative acceleration.
x t Special Points Q R P S
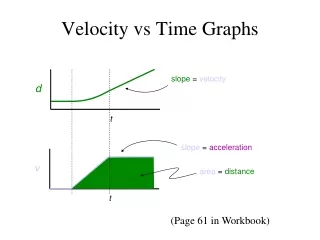
Velocity vs. Time • Horizontal lines = constant velocity • Sloped line = changing velocity • Steeper = greater change in velocity per second • Negative slope = deceleration
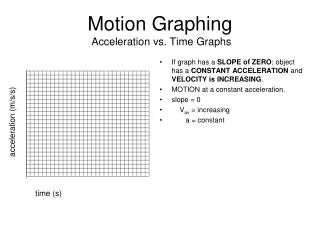
Acceleration vs. Time Time is on the x-axis • Acceleration is on the y-axis • Shows how acceleration changes over a period of time. • Often a horizontal line.
x t All 3 Graphs v t a t
Real life Note how the v graph is pointy and the a graph skips. In real life, the blue points would be smooth curves and the orange segments would be connected. In our class, however, we’ll only deal with constant acceleration. v t a t
Graph Practice Try making all three graphs for the following scenario: 1. Newberry starts out north of home. At time zero he’s driving a cement mixer south very fast at a constant speed. 2. He accidentally runs over an innocent moose crossing the road, so he slows to a stop to check on the poor moose. 3. He pauses for a while until he determines the moose is squashed flat and deader than a doornail. 4. Fleeing the scene of the crime, Newberry takes off again in the same direction, speeding up quickly. 5. When his conscience gets the better of him, he slows, turns around, and returns to the crash site.