Download
1 / 52
520 likes | 627 Views
Introducing GIS and Remote Sensing. Introduction to Mapping and GIS. Think about all the activity occurring though out a landscape. How can we map, manage and analyze all that is going on? GIS!. Rowan University. US Census Data in Excel.

E N D
Introducing GIS and Remote Sensing Introduction to Mapping and GIS
Think about all the activity occurring though out a landscape. How can we map, manage and analyze all that is going on? GIS! Rowan University
US Census Data in Excel Think about keeping information about phenomenon on a landscape. How could you do it?
US Census Data in GIS GIS organizes that data with a map. But GIS is much more….
Data Types Aspatial data—data not tied to a location on the earth’s surface Spatial data—data associated with a location on earth Much of the information we deal with daily has some spatial component.
What is GIS? • Data Management - • Manages various kinds of GIS data including vector, raster, images, tables, other data files • Data models and architectures • Conversion between formats • Import/export utilities • Interacts with RDBMS (SQL Server, Oracle, etc…)
What is GIS? • Analysis • Spatially aware data • Attribute and spatial query • Proximity and Overlay • Advanced geoprocessing techniques • Decision support • Flexible, customization • Programming, scripting (to perform analysis)
What is GIS? • Visualization • Maps! Maps! Maps! • If a picture is worth a 1000 words… • Professional cartographic tool • Charts, graphs, tables, etc… • Various coordinate systems • 2D and 3D • Web, desktop, handheld, etc…
What is GIS? • Data Management – Database View • Analysis – Model View • Visualization – Map View
“G” vs. “IS” • GIS uses maps to spatially analyze and search for patterns in the data that would otherwise not be found. (Content) • GIS stores, manipulates, and displays data files and relationships in a information system using standard computing practices. (IT) • With advances in technology, GIS users must now deal with both aspects!
The “G” • “G” = Geographic • Denotes the concept of spatial location on Earth’s surface • Importance of relative location (not just where you are but where you are in relation to everything else) • Theories and techniques in Geography form the basis of GIS
The “I” • “I” = Information • Substance (knowledge) about location • Factual and interpretative • Tables + Maps + Analysis • Transformation of table information into spatial context for analysis • Technology and computer systems
What about just “GI”? • Yes, it is used quite often. • Commonly used as a replacement for or broadening of the term “GIS data” • But…
What About the “S” in GIS? • Systems • Science • Studies • Services
Geospatial? • Geographic + GIS = “Geospatial” • Move in recent years to better define the industry and to focus on data (business) over geographic principles (academic) • Geospatial includes all subcomponents of GIS embedded in other areas (remote sensing, GPS etc.)
Importance of Layers in GIS • Geographic data = Representation of reality • Reality is complex. • GIS utilizes a layer approach • Each layer only includes information about one type of phenomenon. • Data layers must be aligned with one another
Importance of Layers • Proximity • Finding what is near or within a distance from a certain location or feature e.g., all houses within 100 yards of a stream • Overlay • Combining two layers to create new information e.g., habitat based on veg, elevation, and temp
Families of GIS Data (1) • Vector mode or coordinate based • Three vector objects exist—points, lines, polygons; these are called “features.” • They are represented by X,Y coordinates • sometimes Z (3D), sometimes M (linear reference) • Information about features is (are) called “attributes.” • Two types of vector models—topological and object • Topological means the data models stores relationships between vectors • Vector objects exist independent of any other nearby features
Families of GIS Data (2) • Raster mode or grid cell • Entire study area is covered by a grid • Each cell within grid is given a value • Values can be integer or decimal • Data can be discrete or continuous • Cell size is variable and linked to the file size of the raster data • Areas outside of the grid are ignored • Grid must be expanded if those areas are to be included
Modeling Geospatial Reality Raster Model Vector Model Real World
Vector Mode Model of Reality Reality Coding Vector GIS
node B node C Polygon I Polygon III node A Polygon II node E node F node D Polygon V Polygon IV node G Coding Vector GIS Vector Mode Model of Reality Reality
Raster Mode Model of Reality Reality Coding Raster GIS Data
Coding Raster GIS Data 1 1 1 1 2 3 4 4 1 1 1 2 2 3 4 4 1 2 2 2 3 3 4 4 2 2 2 3 3 4 4 4 3 3 3 3 5 5 5 5 1 1 1 1 6 5 5 5 1 1 1 1 1 5 5 5 1 1 1 1 1 1 5 5 Raster Mode Model of Reality Reality
Advantages of Vector • Vector data make maps that look more like maps we are use to seeing on paper. • The shapes of features are accurately represented. • Vector data can have TOPOLOGY • Vector data is good for managing attributes • Vector data can have smaller dataset • Only the objects need to be represented in the database (empty space in-between is not captured) • Vector
Disadvantages of Vector • Complicated data structure • Software must manage many data tables • Not good at representing geographic features that gradually change over location • For example elevation or moisture in soil • Slower processing time
Advantages of Raster • Good at depicting continuously changing surfaces such as elevation or soil moisture • Grid format is simple data structure • Easier for computer to make analytical calculations • Ideal for utilizing remote sensing images
Disadvantages of Raster • Maps can be blocky looking (depending on the size of the grid cells) • Cells can only be coded for one attribute when there may be more than one attribute at each location • Can have very large datasets (depending on the size of the grid cell) • Is NOT TOPOLOGICAL data structure
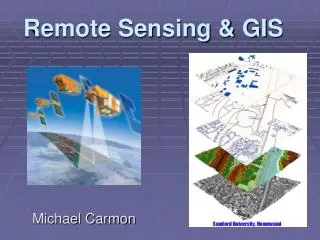
Remote Sensing • Remotely-Sensed data is one of the most important sources of data for GIS. • RS means - Acquiring data from a distance • Usually uses electromagnetic energy • sunlight, radar, laser • Originally captured on photographic film • Recent platforms utilize digital sensors
What kinds of devices collect the data? • Aircraft • High altitude • Low altitude • Spacecraft: • Landsat • SPOT • Weather satellites • GeoEye-1 Geosynchronous Orbitwhen the satellite moves at the same speed as the spinning earth – results in the camera staying over the same spot of the earth
Black and Whiteor “Panchromatic” Sensitive to visible light
Digital Orothographic Photos • Digital photos of the earth • Usually acquired by aircraft • Orthographic means that the photo has all distortion removed • A regular photo from an airplane will have distortion due to: • Parallax – effect that distance away from the center point of a photo will always have distortion • Terrain – the hills and valleys or a land area will cause distortion in the photo • An orthographic photo is adjusted by computer software to make the image line up with a flat map
Digital OIrthographic Photo-quad – Infrared You are here
Remote Sensing Mediums • Black and White or “Panchromatic” • Sensitive to visible light • True Color • Similar to color film • Infrared • Sensitive to infrared frequencies that can’t be seen by humans • Developed by military for identifying tanks painted with camouflage • Good for evaluating conditions of vegetation • Good for evaluating moisture in soil • False-color adjusted • When frequencies of received data are shifted to allow or enhanced human viewing • Multi spectral • When more than a single “band” of energy is captured • Color is multi-spectral (3 bands) • Some satellites can have 7 or even more “bands” of sensitivity
The Visible Spectrum • The visible spectrum is only a tiny window • We are blind to 99.99% of the energy in the universe • We have created devices that allow us to see beyond the range of human vision
Satellite Images • Weather satellite image: Winter in North America.
What are the spatial units for which data are collected? • Pixel or Picture Element • Smallest unit of data collection • Features smaller than the pixel size can’t be distinguished • Pixel Sizes • Landsat MSS = 79 meters • Landsat TM = 30 meters • SPOT = 10 meters • IKONOS = 1 meter • GeoEye-1 = 0.41 meters
Spatial resolution keeps getting better... 1, 3, and10 meters
Temporal Resolution • Remote sensing images begin to get old as soon as they are taken • Satellites repeatedly circle the earth • Airplanes must be commissioned every time they photograph (expensive). • NJ aerial photography was taken 1995, 2002, and 2007. • Statewide aerials often have to be taken in multiple years (95/97) (07/08)
What is GIS? • Now that we’ve learned the essential elements that make up a GIS… • …and have seen examples of how GIS is being used… • …let’s take a look at the big picture.
GIS Is Evolving Systems Networks Projects Integrated Coordinated Cooperative . . . Moving to the Internet and Web Services
How is GIS used? • Sometimes, the best way to learn about GIS is to see how it’s being used….. • Science • Emergency management • Government record-keeping • Business location • Environmental management • Planning • Crime mapping
Creating a Digital Earth Measuring and Integrating Spatial and Thematic Information . . . A Nervous System for Spaceship Earth
Violence in Darfur • Image shows 2004 & 2006. • Area too large and dangerous for small peacekeeping force. • Violence tracked using satellite images. • Article.