Download
1 / 79
2.09k likes | 8.57k Views
Flow Cytometry (Principles and Main Applications). Hossein Asgarian-Omran Ph.D., Immunology Dep. of Immunology, School of Medicine Mazandaran University of Medical Sciences asgarianhossein@yahoo.com. Getting familiar with flow cytometry system

E N D
Flow Cytometry (Principles and Main Applications) Hossein Asgarian-Omran Ph.D., Immunology Dep. of Immunology, School of Medicine Mazandaran University of Medical Sciences asgarianhossein@yahoo.com
Getting familiar with flow cytometry system How to interpret flow cytometry-related results and graphs in scientific documents How to use this system in your own projects Workshop objectives 2
FlowCyto Metry Definition Measuring properties of cells in a flowing system Flow Cytometry is the process whereby such measurements are made upon cells/particles as they pass through a measuring apparatus suspended in a fluid stream. FACS Fluorescence Activated Cell Sorter 3
The first fluorescence-based flow cytometry device (ICP 11): by Wolfgang Göhde (University of Münster, Germany. 1968) The first commercialized by German developer and manufacturer Partec in Göttingen (1968-69) The first FACS instrument from Becton Dickinson (1974) Original name of flow cytometry technology was: "pulse cytophotometry" 8 years later in 1976, at the Conference in Florida, the name was changed to "flow cytometry", a term that quickly became popular. History 4
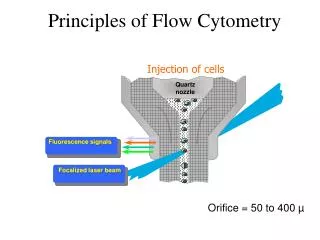
Basics of Flow Cytometry Cells in suspension flow in single-file through an illuminated volume where they scatter light and emit fluorescence that is collected, filtered and converted to digital values that are stored on a computer Fluidics Optics Electronics
Sample Sheath Flow chamber Laser optics Laser Beam Fluidics Cells are presented to the laser using principles of hydrodynamic focusing
Optical Design PMT 6 PMT 5 Sample PMT 4 Dichroic Filters Flow cell PMT 3 Scatter PMT 2 PMT 1 Laser Sensor Bandpass Filters
Optical Filters Dichroic Filter/Mirror at 45 deg Light Source Transmitted Light Reflected light
From Fluorescence to Computer Display Individual cell fluorescence quanta is picked up by the various detectors (Photo Multipliers Tubes, PMT’s). PMT’s convert light into electrical pulses and amplify them. These electrical signals are digitized using Analog to Digital Converters (ADC’s). Different parameters are determined for each single event.
Different Parameters Measured by Flow Cytometry No reagents or probes required (Structural) Cell size (Forward Light Scatter) Cytoplasmic granularity (Side Light Scatter) Reagents are required. - Mostly fluorescent probes Intrinsic Extrinsic
Laser FALS Sensor Forward Angle Light Scatter or FSC
Laser FALS Sensor 90LS Sensor 90 Degree Light Scatter or SSC
Common Fluorophores • Natural: PI, EB, AO • Organic: FITC, APC, PE, PerCP • Tandem: PECY7, PECY5.5, APC-tandem • Nanocrystal: Q-dot(Invitrogen), eFluor (eBiosciences) and Brilliant Violet (Biolegend and BD Biosciences)
Common Fluorophores in Flow Cytometry Wavelength 400 nm 500 nm 600 nm 700 nm Excitation Emission Fluorescein (FITC)
Fluorochromes (cont…) Wavelength 400 nm 500 nm 600 nm 700 nm Excitation Emission Phycoerythrin (PE)
350 457 488 514 610 632 300 nm 400 nm 500 nm 600 nm 700 nm Common Laser Lines PE-TR Conj. Texas Red PI Ethidium PE FITC cis-Parinaric acid
FITC R_PhycoErythrin (PE) 400 400 450 450 500 500 550 550 600 600 650 650 700 700 Common Fluorochromes:FITC and Phycoerythrin
Cascade Blue 440/40 Cascade Yellow 545/90 525/50 FITC PE 575/25 665/30 PE.Cy5 695/40 PE.Cy5.5 PE.Cy7 784/45 625/40 TexasRed 660/40 APC 705/50 APC.Cy5.5 750LP APC.Cy7 350 400 450 500 550 600 650 700 750 800 850 Fluorochrome Combinations: 3 lasers, 11 colour immunofluorescence Wavelength (nm)
Panel Designing • Instrument configuration and characterization • Dye selection based on lasers and filters • Proper reagent selection
1 Parameter Histogram Positive Negative Brighter Count Dimmer 6 4 1 1 2 3 4 6 7 150 160 170 .. 190 Channel Number Fluorescence picked up from the FITC PMT
2 Parameters Dot Plot Single Positive PI Population Double Positive Population PE FL Negative Population Single Positive FITC Population FITC FL
Quadrant Dot-Plot for Double Positive Cells Gating on Negative Control
FITC FITC FITC FITC FITC FITC FITC FITC FITC FITC Fluorescence intensity Number of Events 101 102 103 104 Relative fluorescence intensity
Gating in Flow Cytometry A gate is a numerical or graphical boundary that can be used to define the characteristics of particles to include for further analysis Granulocytes Lymphocytes SSC Monocytes FSC
Granulocytes Lymphocytes SSC Monocytes RBCs, Debris, Dead Cells FSC Why Look at FSC v. SSC • Since FSC ~ size and SSC ~ internal structure, a correlated measurement between them can allow for differentiation of cell types in a heterogeneous cell population
Different Gating Strategies in Flow Cytometry • Polygon • Region or range • Quadrant
Compensation The most important challenge in multi-color flow cytometry