Download
1 / 21
210 likes | 238 Views
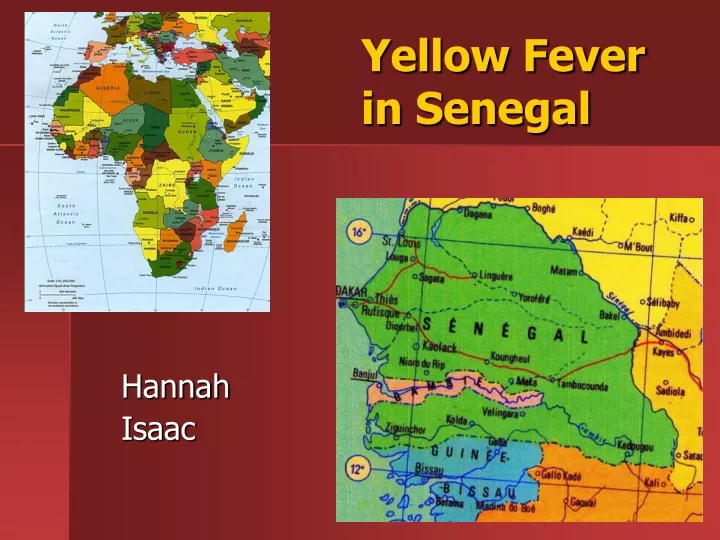
Explore the Yellow Fever outbreak in Senegal using a mathematical model. Learn about disease background, model predictions, and comparisons with data to understand the transmission dynamics and control measures.

E N D
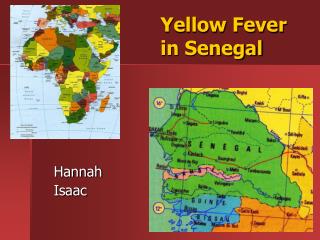
Yellow Fever in Senegal Hannah Isaac
Outline • Disease Background • Model • Comparison with Data • Model Predictions • Conclusions and Further Work
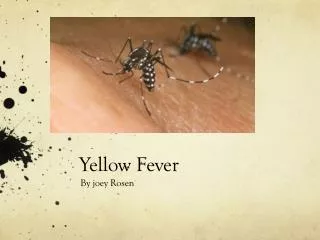
Disease Background • First account of sickness diagnosed as YF occurred in 1648 • Causative agent: genus Flavivirus • Vector: Aedes aegypti (mosquito) • Nonhuman primates maintain disease http://www.tel.hr/public-health/bolesti/krpeljni2.htm http://www.gemsvt.org/middle/grade7/science/resources.htm http://www.ahajokes.com/crt050.html
Cycles of YF Transmission Jungle Village City MOSQUITO MOSQUITO MOSQUITO HUMAN, MONKEY HUMAN HUMAN MONKEY MOSQUITO MOSQUITO MOSQUITO www.who.int
Model Simplifications • Endemic presence of disease in the jungle • Consider urban outbreak only • Disease brought to city though movement of infected humans (initial condition) http://www.ac-grenoble.fr/irem/sergesimplification.htm
Exposed* Infective** Recovered*** Susceptible Vaccinated *Virus incubating **Contagious ***Includes: survivors, victims, Immune The SEVIR Model Humans can be in one of five categories at a time
Assumptions • 100% transmission • Linear vaccination term, 1 week lag • Pesticides affect the birth rate continuously • No mosquito larval stage • Homogeneous mixing of people
Exposed Vaccinated Vaccinated Immune Exposed Exposed Infective System of Equations: Humans
Infective Recovered Dead System of Equations: Humans The Mathemagician http://www.mathsci.appstate.edu/u/math/sjg/simpsonsmath/index.html
Birth Death & Infective Exposed Exposed Birth & Death Death Infective System of Equations: Mosquitoes
Parameters • Humans: • Population: NH = 800 000 • Incubation rate: δ = 1/12 (people/day) • Death rate: ψ = 0.08/14 (people/day) • Recovery rate: r = 0.92/14 (people/day) http://www.aclassmedicine.org/diet.html
Parameters Cont’d • Mosquitoes: • Number of Mosquitoes: NM = 100 000 000 • Biting rate: μ = 1/10 (bites/day·mosquito) • Birth rate*: α = 0.11 (mosquitoes/day) • Death rate: β = 0.25 (mosquitoes/day) • Incubation rate: ε = 1/12 (mosquitoes/day) *Low due to insecticide use
Model vs. Data for 2002 Outbreak Cumulative Cases Days
New Cases Days The “Epidemic Curve” Clear peak at ~20 days, no new Infections after 100 days
Predictive Power • Parameters can be changed to make useful predictions: • Changing control parameters • Varying disease introduction
Cumulative Cases Days Without Pesticide Controlled epidemic (vaccine) with a higher number of total cases (~400)
Cumulative Cases Days Without Vaccine Controlled epidemic (pesticide) with a higher number of total cases (~450)
Cumulative Cases Days No Controls (pesticide or vaccine) Disease is rampant!
Cumulative Cases Days Introduction of Disease Through Pre-Contagious Humans Vaccine takes effect before contagious period begins
Conclusions • Single urban compartment well-described by model • Parameter adjustment has realistic effects • Future models should include progression through jungle and village
Thanks to... Gary, Joanna, Alex, and all the other instructors and math campers Math Camp