Download
1 / 13
130 likes | 146 Views
Dive into the world of spectroscopy and how it reveals crucial information about stars, from their chemical composition and temperature to movement and magnetic fields. Learn about bright and dark line spectra, the use of a spectroscope to analyze stars, and the fascinating patterns of light emitted or absorbed by celestial objects. Explore the rainbow of colors in the visible light spectrum and grasp the significance of continuous and line spectra in unraveling the mysteries of the cosmos. Discover how scientists decode the spectral fingerprints of stars to uncover their inner workings.

E N D
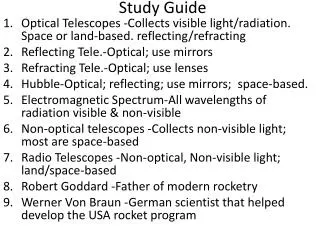
Spectroscopy • Spectral analysis provides information about an object’s… a. Outer layer chemical composition of stars. b. Temperature of stars c. Movement of stars, if the distance between the star and the Earth is increasing or decreasing. (Doppler Effect – Red Shift, Blue Shift)
Spectroscopy d. Pressure of a star e. Presence of magnetic fields f. Condition of the gases in the star g. Size of the star
Spectroscope • Spectroscope – the tool used to separate starlight into its colors. • Is used for spectral analysis of stars.
Visible Light • When visible light (white light) is passed through a prism a continuous spectrum is formed. Each color has a different wavelength. As a result each color is refracted (bent) a different amount. • Elements radiate light into specific wavelength combinations that form banding patterns “fingerprints.”
Rays of Sunlight Violet Indigo Blue Green Yellow Orange Red Spectrum of Colors Ray bent least- longest wavelength Visible Light Ray bent most- shortest wavelength
Continuous Spectrum • Unbroken band of colors – shows that its source is sending out light of all visible wavelengths.
Continuous Spectrum • Sources - glowing solid, hot filament of light - glowing liquid, molten iron - hot compressed gases deep inside a star • Example – incandescent light bulb
Bright Line Spectrum (Emission Spectrum) • An unevenly spaced series of lines of different colors and brightness. • The bright lines show the source is emitting light in certain wavelengths. II I II I II I
Bright Line Spectrum (Emission Spectrum) • Each element has its own unique bright-line spectrum. • Clouds of hot gas around young stars produce emission lines. • Example – Gas Tubes II I II I II I
Dark-Line Spectrum (Absorption Spectrum) • A continuous spectrum with dark lines where light is absorbed. • These lines are called Fraunhofer Lines. I I I I I I I I
Dark-Line Spectrum (Absorption Spectrum) • The dark lines are in the exact same spot as the same element in a bright-line spectrum. • Forms when light passes through a cooler gas. The gas absorbs the same wavelengths, as it would give off if heated. Example – Star. I I I I I I I I
Dark-Line Spectrum (Absorption Spectrum) • The position of the dark lines is used to identify the elements in the star. • By looking at the dark-line spectrum of the sun more that 80 elements have been identified. • Example – Sun I I I I I I I I