Download
1 / 17
170 likes | 186 Views
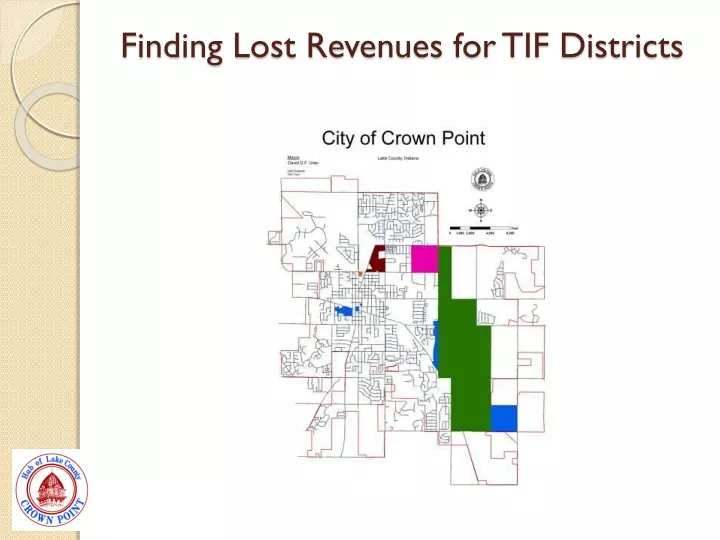
This project aimed to identify lost revenues in TIF districts by verifying properties, updating records, and developing a plan for future accuracy. Researching properties, mapping TIF boundaries, and aligning tax records helped reveal unrecorded properties and increase revenue substantially. Collaborating with the county auditor's office, creating individual maps, and providing detailed reports were key steps in the process. By categorizing properties correctly and ensuring proper recording, the TIF fund experienced a significant annual revenue boost. For inquiries, contact Dan Niksch, City of Crown Point GIS Coordinator, at dniksch@crownpoint.in.gov or 219-662-3242.

E N D
Goal of the Project • Determine Current Monies Being Received • Research Properties with Correct TIF Indications • Find additional Properties Within TIF Boundaries Not Recorded Correctly • Check Values of Non-Recorded Properties and Have them Recorded Properly • Develop a Plan to Properly Record Future Properties Correctly
Current Monies Being Collected • Worked with county auditor office to see monies being brought in. • Roughly $450,000 brought in before project annually
Research of TIF Properties • Checked 2 years of tax records to verify what properties were being recorded. • Mapped out the current properties that were being recorded by the county office as being in a TIF district.
Find Properties Not Recorded • Compared the last 2 tax years to verify properties not recorded. • Mapped out properties that were within the TIF borders but not recorded as such.
Analyzing the Results • Created individual area maps showing properties that were in question. • Gathered data on each property to see the amount of tax money that was being brought in and how it was dispersed.
Solutions • Divided City up into 24 sections • Created Individual maps on each area to highlight properties • Created detailed excel database to show all taxing information from the auditor office for the study • Provided auditor office with our reports to show properties along with property ID numbers to be recorded.
Solutions • New parcel splits are to be handled by Planning Department • GIS Department is to monitor current parcels to make sure they are recorded properly.
Results of the Study? • Found an excess of 580 properties that were excluded from TIF districts • Properties were categorized correctly from here forward • TIF fund went from roughly $450,000 a year • To now over $2.4 Million per year
Questions?Dan NikschCity of Crown PointGIS Coordinatordniksch@crownpoint.in.gov219-662-3242