Download
1 / 18
190 likes | 620 Views
Can be represented with scale showing real world distance on map ... Smaller scale maps have smaller scale fractions. Distance on map represents greater ...

E N D
Slide 1:J426/J520/V550 Class 3 January 19, 2010
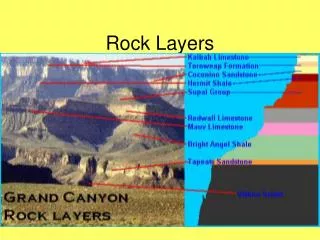
Slide 2:GIS layers Map scale Feature attributes
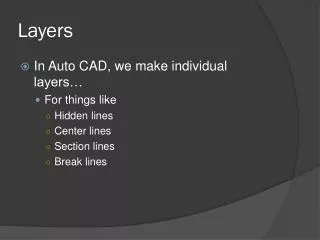
Slide 3:Multiple layers of geographic information displayed on single map Geographic features Points, lines, areas Geographic surfaces E.g., crime density surfaces Images Aerial photographs Satellite images
Slide 6:Points Using various symbols, colors, sizes Lines Using various line widths, patterns, colors Areas Using various colors, patterns
Slide 7:Points Location of Business -SPEA building Lines Roads Rivers Areas Indianapolis and other cities and towns Parks Geist Reservoir
Slide 8:Roads, rivers represented as areas
Slide 9:Indianapolis, other cities represented as points Note different symbols for state capitals, other cities
Slide 10:Relationship of distances on map to distances in real world Can be represented with scale showing real world distance on map Can be represented with statement such as �one inch equals 10 miles� In GIS, most generally represented as a fraction, relationship of distance on map to distance in real world
Slide 11:Various ways of indicating scale fractions 1 to 50,000 1 / 50,000 1 : 50,000 Means 1 inch on map represents 50,000 inches on ground
Slide 12:1 inch = 10 miles 1 : 633,600 Scale on map (based on printing out slide on 8 � x 11 paper)
Slide 13:Larger scale maps have larger scale fractions Distance on map represents less distance on earth Map covers smaller area Smaller scale maps have smaller scale fractions Distance on map represents greater distance on earth Map covers larger area
Larger scale 1 : 9,000 Smaller scale 1 : 15,200,000Slide 15:Geographic features (points, lines, areas) on map� Linked to attribute information about those features in table Allows identification of attributes for any feature Allows use of attribute data in analysis