1 / 1

R Holme & O de Viron Nature 499 , 202-204 (2013) doi:10.1038/nature12282

Fit to D LOD data (black line) of 5.9-year oscillation and decadal trend (grey line). R Holme & O de Viron Nature 499 , 202-204 (2013) doi:10.1038/nature12282.

mercia
Download Presentation

R Holme & O de Viron Nature 499 , 202-204 (2013) doi:10.1038/nature12282

An Image/Link below is provided (as is) to download presentation Download Policy: Content on the Website is provided to you AS IS for your information and personal use and may not be sold / licensed / shared on other websites without getting consent from its author. Content is provided to you AS IS for your information and personal use only. Download presentation by click this link. While downloading, if for some reason you are not able to download a presentation, the publisher may have deleted the file from their server. During download, if you can't get a presentation, the file might be deleted by the publisher.

E N D

Presentation Transcript


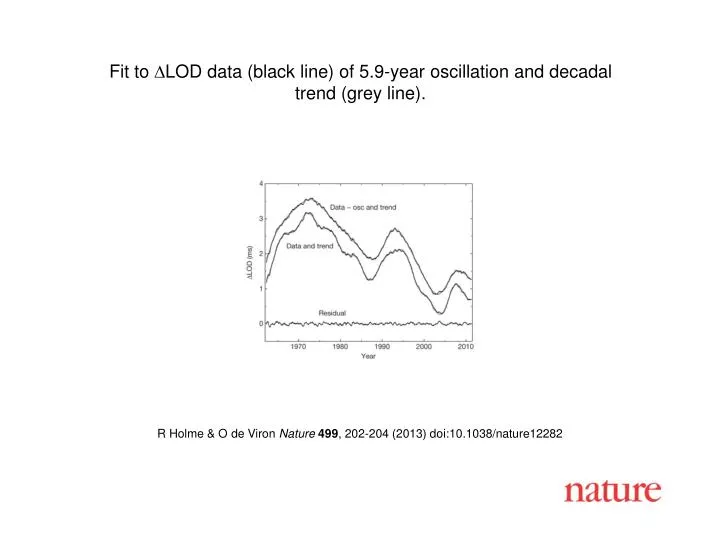
  1. Fit to DLOD data (black line) of 5.9-year oscillation and decadal trend (grey line). R Holme & O de Viron Nature 499, 202-204 (2013) doi:10.1038/nature12282

More Related