Download
1 / 15
160 likes | 697 Views
Gene Flow. Rainbow and Westslope Cutthroat Trout Hybridization. Rainbow Trout ( Oncorhynchus mykiss ). Insectivore, piscivore Adfluvial spawners April-July Thrive in cool streams, lakes (“Rainbow Trout,” n.d .). Rainbow Trout Distribution. (“Rainbow Trout,” n.d .).

E N D
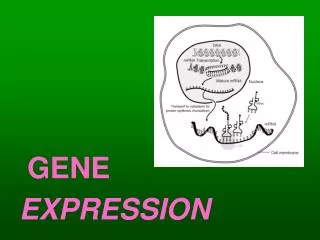
Gene Flow Rainbow and Westslope Cutthroat Trout Hybridization
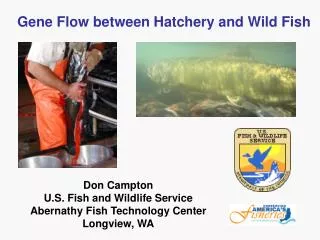
Rainbow Trout (Oncorhynchusmykiss) • Insectivore, piscivore • Adfluvialspawners April-July • Thrive in cool streams, lakes (“Rainbow Trout,” n.d.).
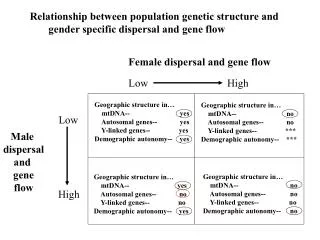
Rainbow Trout Distribution (“Rainbow Trout,” n.d.)
Westslope Cutthroat Trout • Insectivore • Adfluvial, fluvial, resident spawners April-July • Thrive in cool streams, lakes (“Westslope Cutthroat, Trout” n.d.).
Westslope Cutthroat Distribution “Westslope Cutthroat, Trout” n.d.).
Design an experiment to test your hypothesis of rainbow, cutthroat, and hybrid populations on the North Fork Flathead River. Hypothesis: Procedures: Independent variable: Dependent variable: Control:
References • Rainbow Trout — Oncorhynchusmykiss. Montana Field Guide. Montana Natural Heritage Program and Montana Fish, Wildlife and Parks. Retrieved on March 28, 2014, from http://FieldGuide.mt.gov/detail_AFCHA02090.aspx • Westslope Cutthroat Trout — Oncorhynchusclarkiilewisi. Montana Field Guide. Montana Natural Heritage Program and Montana Fish, Wildlife and Parks. Retrieved on March 28, 2014, from http://FieldGuide.mt.gov/detail_AFCHA02088.aspx
Methods • Catch fish through electrofishing • Take genetic samples • Record data • Study 31 sections or tributaries
Each of you will have the genetic data from one of 24 locations. Your job is to figure out which fish are rainbows, cutthroat, or hybrids . We will combine our data to find a picture of gene flow in the whole system.
Analyzing Data • Circle rainbow alleles in purple • Circle cutthroat alleles in orange • Calculate individual hybrids • # rainbow alleles/2(diagnostic loci). • For instance, a pure rainbow would be 14/2(7) = 1 or 100% • Calculate hybridization in population • # rainbow alleles in population/2(# of individual)(# of loci). • For instance, 448/2(35 x 7) = .916 or 91.6 %
Compiling Data • Period 2: https://docs.google.com/spreadsheets/d/1K1sIk87mY6X-n0SYLOqQj5G7G4jg_sIDVmkcD8tXxJ4/edit?usp=sharing • Period 3: https://docs.google.com/spreadsheets/d/1ANo6v6-F0NsDo99wXBx8aReR4KMkyefeilS_-ZL3lAg/edit?usp=sharing • Period 4: https://docs.google.com/spreadsheets/d/1OXSJLa2jEQ9gaSa0K-vMq6VH3t9byK5c8xl8EsPpWQQ/edit?usp=sharing • What sort of trends does the data reveal? • How does the data support or discount your hypothesis? • What conclusions do you now form about hybridization in the North Fork?
Culmination • Reveal your understanding of genetics, evolution, and ecology by writing three essays based on the following prompt. • It is essential that your writing exhibits scientific understanding and vocabulary. Use the data from this experiment and concepts from our units as evidence and analysis within your paragraphs. • How does genetics provide a valuable tool for biologists studying trout? • Is this population of trout in the North Fork evolving? • What should we do about hybridization in the North Fork? How does ecology provide evidence for your conclusion?