Download
1 / 1

E N D
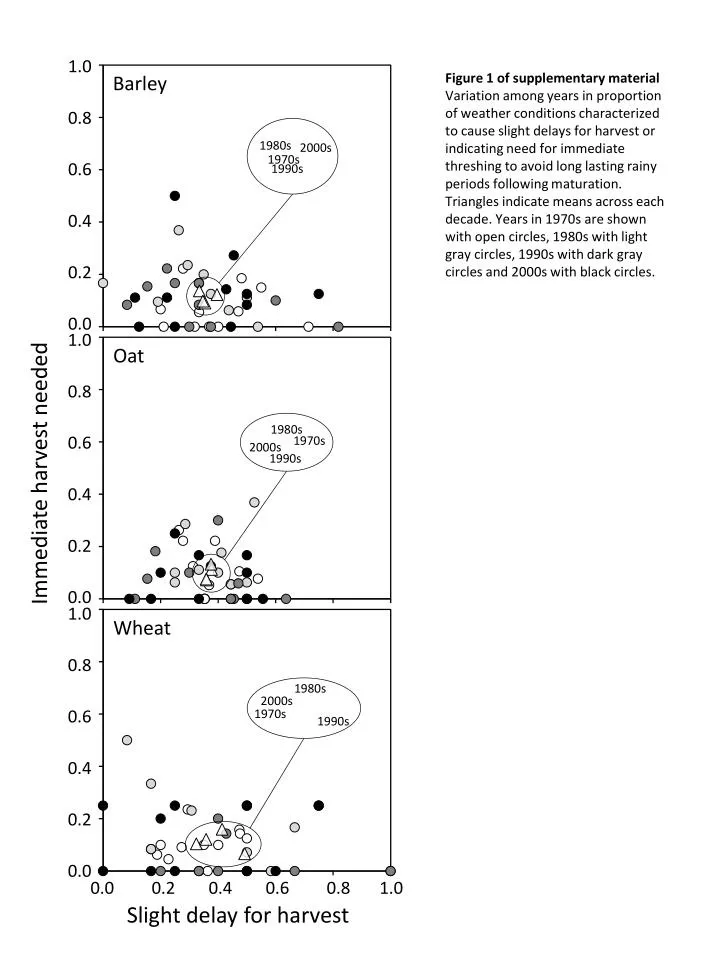
1.0 0.8 0.6 0.4 0.2 0.0 Barley Figure 1 of supplementary material Variation among years in proportion of weather conditions characterized to cause slight delays for harvest or indicating need for immediate threshing to avoid long lasting rainy periods following maturation. Triangles indicate means across each decade. Years in 1970s are shown with open circles, 1980s with light gray circles, 1990s with dark gray circles and 2000s with black circles. 1980s 2000s 1970s 1990s 1.0 0.8 0.6 0.4 0.2 0.0 Oat 1980s 1970s 2000s 1990s Immediate harvest needed 1.0 0.8 0.6 0.4 0.2 0.0 Wheat 1980s 2000s 1970s 1990s 0.0 0.2 0.4 0.6 0.8 1.0 Slight delay for harvest