Download
1 / 9
90 likes | 358 Views
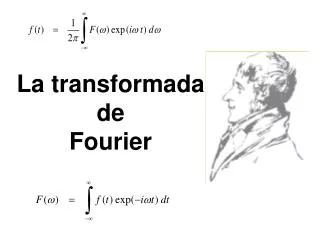
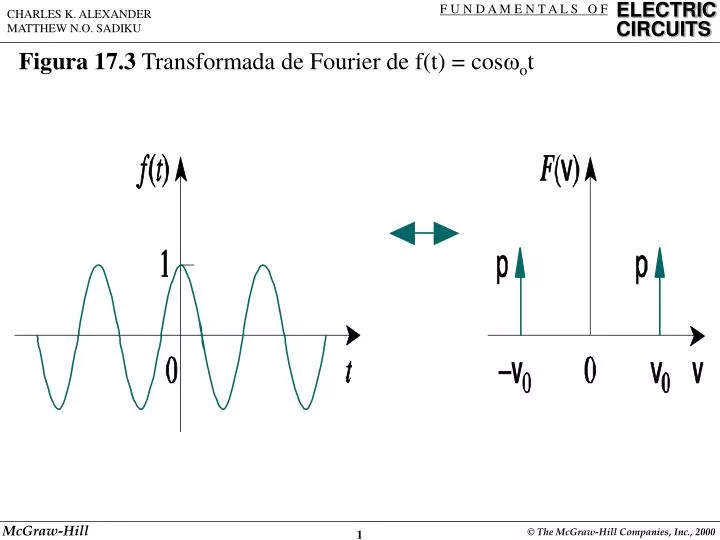
Figura 17.3 Transformada de Fourier de f(t) = cos o t. Figura 17.10 E spectro de amplitud de: ( a ) señal f(t), ( b ) señal modulada f(t) cos t. Figura 17.12 Ilustración gráfica de la propiedad de convolución.

E N D
Figura 17.10 Espectro de amplitud de: (a) señal f(t), (b) señal modulada f(t) cos t
Figura 17.12 Ilustración gráfica de la propiedad de convolución
Figura 17.17 Relación entrada-salida de un circuito en el dominio de frecuencia
Figura 17.22Dominio de tiempo y despliegue de frecuencia de: (a) señal de modulación, (b) señal portadora, (c) señal AM
Figura 17.22 Dominio de tiempo y despliegue de frecuencia de: (a) señal de modulación, (b) señal portadora, (c) señal AM
Figura 17.22 Dominio de tiempo y despliegue de frecuencia de: (a) señal de modulación, (b) señal portadora, (c) señal AM
Figura 17.24 Espectro de frecuencia de: (a) señal de modulación, (b) señal AM