Download
1 / 28
280 likes | 293 Views
Explore national trends in using local indicators for community change, including the availability of neighborhood-level data, advances in technology, and the importance of knowledge, partnerships, and communication. Learn from examples of successful initiatives from cities across the US.

E N D
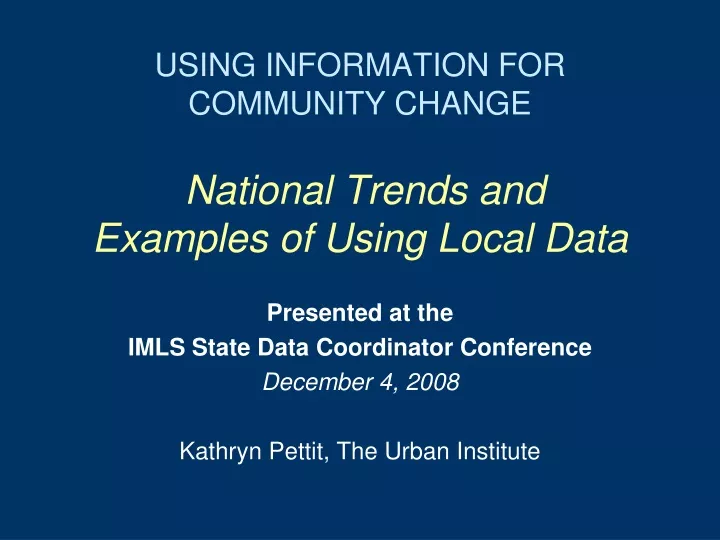
USING INFORMATION FORCOMMUNITY CHANGENational Trends and Examples of Using Local Data Presented at the IMLS State Data Coordinator Conference December 4, 2008 Kathryn Pettit, The Urban Institute
National Trends in Using Local Indicators • More neighborhood level data available than ever before • Online property data • No Child Left Behind reporting requirements • Increased role for local administrative data • Decennial Census now eight years out of date • American Community Survey tract data not out until 2010 • Advances in usability and functionality of technology • Wider understanding of benefits from tailoring programs & policies to local conditions
National Trends in Using Local Indicators • But, still often difficult to find relevant, up-to-date data at the desired geography for community action • And more than data is needed • Knowledge and respect of the community • Committed institutions • Strong partnerships among organizations • Effective communication & advocacy
National NeighborhoodIndicators Partnership (NNIP) • Collaborative effort since 1995 • Urban Institute and local partners in 31 U.S. cities • Partners operate information systems • Recurrently updated neighborhood data • Multiple topics and data sources • Success required three innovations 1. Data and technology 2. Institutions • Using information for change
National Neighborhood Indicators Partners AtlantaBaltimore Boston Camden Chattanooga Chicago Cleveland Columbus Dallas Denver Des Moines Grand Rapids Hartford Indianapolis Louisville Los Angeles Memphis Miami Milwaukee Minneapolis Nashville New Haven New Orleans New York City Oakland Philadelphia Pittsburgh Providence Sacramento Seattle Washington, DC
NEIGHBORHOOD CITY TRACTS PARCEL BLOCK GROUPS BLOCKS Data and Technology Linking people information with place information • Problems are not evenly distributed across cities. • Priority issues vary across neighborhoods. • People can relate to data analysis at the neighborhood level.
Neighborhood level –social/economic/physical Employment Births, deaths Crimes TANF, Food Stamps Child care Health Schools Parcel level – physical/economic Property sales, prices Property ownership Code violations Assessed values Tax arrears Vacant/abandoned City/CDC plans NNIP Partners Data from Many Sources
New Types of Institutions • Mostly outside of government • Stand-alone nonprofit, university centers, alliance • But partner with resident groups, nonprofits, government, and other stakeholders • Long-term and multifaceted interests • Positioned to maintain trust of data providers and users
Shared Mission: Information for Change • Democratizing Information • Facilitate the direct use of data by stakeholders • Work for many clients • Technical assistance to nonprofits • Informing city’s service provision • Market analysis for local retail • But a central focus on strengthening, empowering low-income neighborhoods • Information as a bridge for collaboration among public agencies, nonprofits, businesses
Joint Work Program of the NNIP Partnership • Advance the state of practice • Informing local policy initiatives (cross-site projects) • Developing tools and guides • Build/strengthen local capacity • Developing capacity in new communities • Services to an expanding network • Influence national context/partnering • Leadership in building the field
Using Information for Change:Stories from Other Cities • Improving literacy programs (Chattanooga) • Supporting public library planning (Milwaukee) • Residential instability and children’s well-being (Providence)
MilwaukeeSupporting Public Library Facilities and Program Planning
COMMUNITY PATTERNS AND TRENDS IMPORTANT TO PUBLIC LIBRARY PLANNING A. Population Trends B. Race and Ethnicity Patterns C. Challenges in Milwaukee Neighborhoods D. Community Assets E. Library Use Patterns
ANALYZING LIBRARY USE Summary of Users by Library • Distribution of Active Card Holders • Current Circulation - Items Checked Out in July, 2007 Market Reach for Branches • Distance matters! Libraries serve 75% of card holders within 2.5 miles. • Three libraries have very close service patterns, another three branch libraries have wider service patterns Mapping Library Use Patterns • Concentrations of Card Holders • Average Rate of Use by Age Group
KEY FINDINGS A. How will population patterns change? B. What challenges that neighborhoods face affect library programming? C. Where are the gaps in library coverage?
Students in mobile households have lower test scores Percent of students meeting testing standards
Prenatal care by mobility status Risk factors can identify families more likely to face residential instability
How Libraries Can Use Neighborhood Level Data • Analyze data for internal planning • Both library data and other data that describes the community and trends • Share library usage patterns for program improvement and advocacy • Early Childhood Development, Adult Literacy, English as a Foreign Language Programs • Serve as a resource for public on neighborhood level data in your area • Become familiar with nationally available systems ex: www.policymap.org, beta.dataplace.org, • Host training sessions
For more information Web site: www.urban.org/nnip Email: kpettit@ui.urban.org Mailing address: Kathy Pettit National Neighborhood Indicators Partnership c/o The Urban Institute 2100 M Street NW Washington, DC 20037