Download

1 / 26
280 likes | 340 Views
Explore population concentrations, density, and factors influencing human settlement across different regions. Learn about the impact of birth rates, demographics in MDCs and LDCs, and the distribution of populations worldwide.

E N D
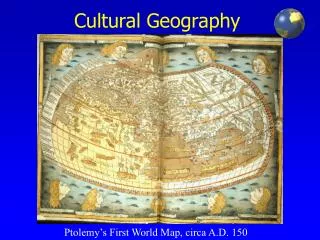
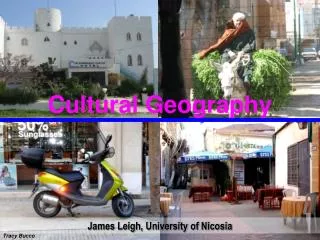
Cultural Geography James Leigh, University of Nicosia Tracy Bucco
PopulationPart 1 Crowd, http://lbcpastor.wordpress.com/tag/service/
This lecture’s reading • Rubenstein, J. (2005), The Cultural Landscape: An Introduction to Human Geography, Latest Edition, Saddle River,Prentice Hall. • Chapter: Population • Fellman, J. Getis, A. and Getis, J. (2005), Human Geography: Landscapes of Human Activities, Latest Edition, New York, McGraw-Hill. • Chapter: Populations: World Patterns, Regional Trends
Preview summary • MDCs: • low birth rates lead to • aging and • slowly growing population • only partly offset by immigration • LDCs: • high birth rates lead to • young and rapidly growing population • which siphons off any economic surplus • and exhausts the economic ability of the country to supply a life of wellbeing to its people • (Corruption and lack of organization and infrastructure are also huge problems) (Tracy Bucco)
Some global facts • More people alive now than ever – 6.5 billion people • In last half of the 20th century world populations increased rapidly • Virtually all global population growth is concentrated LDCs • MDCs have stable or shrinking populations • World pockets of over- and under- population
Population concentrations • 75% world population live on 5% of earth’s surface • World population clusters in 5 areas: • East Asia • South Asia • Southeast Asia • Western Europe • Eastern Nth America • On the population cartogram countrysize is related to population Population cartogram, http://www.santafe.edu/~mgastner/cartogram/cartogram.html
Population density, http://www.maps.com/ref_map.aspx?pid=12867
Where do they live? ~ 88% ~ 12% (Fellmann et al)
Where are the people? • Population largely clustered 10o - 55oN • In low flat areas, near oceans or rivers with good soil • Not in dry, polar orhighland areas Climates,http://www.countrywatch.com/facts/facts_default.aspx?type=image&img=GC Population density, http://www.maps.com/ref_map.aspx?pid=12867
Sparselypopulated areas • Humans avoid harsh environments • Permanently settled areas are the ecumene: not too wet/dry or too hot/cold or too high or too mountainous • The ecumene world area ever increases Ecumene shown in greens (Rubenstein)
5 hypotheses: where we don’t live • Dry • Wet (?) • Hot • Cold • High http://skyblu.files.wordpress.com/2007/05/hot-world.jpg
World Deserts, http://www.powayusd.com/teachers/blees/desert_locations.htm Sparsely populated areas • Dry Lands • 20% earth’s surface • Largest areas: 15o-50o N, and 20o-50o S • N Africa and SW and central Asia • Nomads and oil rich, some irrigation Population density, http://www.maps.com/ref_map.aspx?pid=12867
Population density, http://www.maps.com/ref_map.aspx?pid=12867 Sparsely populated areas • Wet Lands • Very wet areas areinhospitable • 20o N and S or equator • Interiors of S America,Central Africa, SE Asia • At least 1.25 m and most2.25 m rainfall • Rain + heat depleted soil, makes agriculture difficult • Rainfall may be seasonal or spread across the year • Seasonal wet lands can grow food, e.g. rice in SE Asia Humid tropical areas, http://www.nature.com/nrmicro/journal/v4/n9_supp/fig_tab/nrmicro1525_F2.html
Population density, http://www.maps.com/ref_map.aspx?pid=12867 Sparsely populated areas • Hot lands • N & S Africa • Middle East • Persian Gulf • N Australia • W USA • Many are deserts • Hostile environment • Demands changed behaviour Hottest deserts, http://www.didcotgirls.oxon.sch.uk/depts/geog/bcs_geography/deserts.htm
Sparsely populated areas • Cold Lands • N and S poles with extreme cold and permafrost • Polar regions have: • Actually little precipitation • Can’t crop or have animals • Few humans Population density, http://www.maps.com/ref_map.aspx?pid=12867 Cold lands, http://www.athropolis.com/weather1.htm
Sparsely populated areas • High Lands • Steep, snow cover and few people • ½ Switzerland is >1,000 m high, only 5% of people live there • Some exceptions: S America and Africa where high altitude living may be more comfortable • E.g. Mexico City 2,243 m high, Nairobi 1,800 m high Population density, http://www.maps.com/ref_map.aspx?pid=12867 Relief mag, http://geology.com/world/world-map.shtml
Population density: Arithmetic density (Rubenstein)
Population density: Physiological density (Rubenstein)
Agricultural density • Agricultural density: Number of farmers for arable land area Tractor, http://www.tradebit.com/filedetail.php/834639-case-580c-tractor-workshop-service-repair-manual
Population density compared (Bernstein)
Population measurements • (Crude) Birth Rate (CBR): • Number of births for 1,000 people in a year CBR, http://commons.wikimedia.org/wiki/File:Birth_rate_figures_for_countries.PNG
Contraception, http://www.wwan.cn/Pubs/chronicle/2002/issue3/0302p44_contraceptives_map.jpg
World abortion laws Abortion laws, http://www.johnstonsarchive.net/policy/abortion/mapworldablegs.gif
Population measurements • (Crude) Death Rate (CDR): • Number of death for 1,000 people in a year CDR, http://www.geographyalltheway.com/ib_geography/ib_population/popn_mort_revision.htm
Population measurements • Natural Increase Rate (NIR): • NIR = CBR – CDR • This figure excludes immigration NIR, http://www.countrywatch.com/facts/facts_default.aspx?type=image&img=PIAG
Many visual items are used in the course. • They have been collected in “notes” over several years. • If any items are unreferenced please let us know. • We would be happy to give credits. • James Leigh, University of Nicosia Tracy Bucco