Download
1 / 20
230 likes | 464 Views
Energy Infrastructure. Washington D.C. April 5, 2005. Renewable and Other. Renewable. Nuclear. and Other. Coal. Nuclear. 7%. Coal. 8%. Dry Natural Gas. 22%. Oil and Petroleum Products. Natural. Oil. Gas. 40%. 23%.

E N D
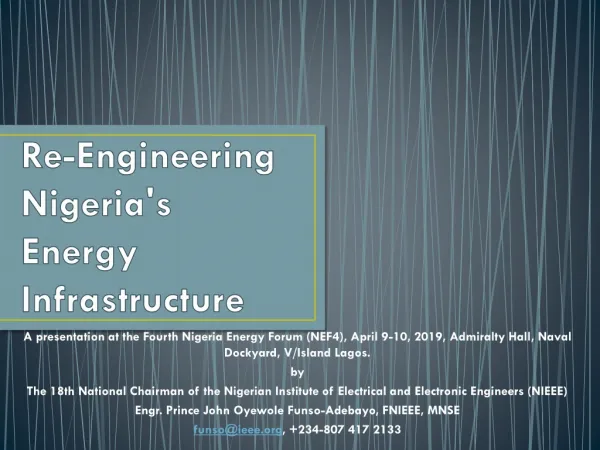
Energy Infrastructure Washington D.C. April 5, 2005
Renewable and Other Renewable Nuclear and Other Coal Nuclear 7% Coal 8% Dry Natural Gas 22% Oil and Petroleum Products Natural Oil Gas 40% 23% The total U.S. energy consumption in 2004 was nearly 100 quadrillion Btus Source: Based on data from EIA Annual Energy Outlook 2005 Pat Wood, III: Federal Energy Regulatory Commission
Projected domestic energy production shows 3% growth from 2004 to 2005, then leveling off until after 2016. Renewable and Other Nuclear Coal Dry Natural Gas Oil and Petroleum Products Source: Based on data from EIA Annual Energy Outlook 2005 Pat Wood, III: Federal Energy Regulatory Commission
Energy imports are projected to increase Coal Natural Gas Oil and Petroleum Products Source: Based on data from EIA Annual Energy Outlook 2005 Pat Wood, III: Federal Energy Regulatory Commission
Relicensed Projects Newly Licensed Projects A total of 131 new hydropower licenses and relicenses have been issued since June 2001 Pat Wood, III: Federal Energy Regulatory Commission
Major Pipeline Projects Certificated (MMcf/d)June 2001 to March 2005 1. Algonquin (285) 2. Islander East (285) 3. Iroquois (230,85) 4. Columbia (135,270) 5. Algonquin (140) 6. Transcontinental (105) 7. Transcontinental (130) 8. Tennessee (200) 9. Maritimes (360) 10. Algonquin (301) Georgia Straits (96) GTN (207) 6. CIG (282,92) 7. CIG (118) 8. TransColorado (125) 9. WIC (116) Northwest (162,113) Northwest (224) Millenium (700) WBI (80) Iroquois(70) ANR (210,220, 107,143) 9 8 10 1 Northwest (191) 5 Tuscarora (96) Horizon (380) 2 7 NFS/DTI (150) 3 6 7 Cheyenne Plains (560,170) 9 Questar (272,102) TETCO(223) 4 TETCO(250) 8 6 Cove Point (445) Kern River (886) Greenbrier (600) El Paso (140) East Tennessee (510) Kern River (282) East Tennessee (170) Transwestern (150,375) Transco (323) TETCO (197) Otay Mesa (110) SCG Pipeline (190) North Baja (500) El Paso (320,620) Petal (700,600) Southern (330) Discovery (150) Florida Gas (270) Trunkline (200) Trunkline(1,500) Calypso (832) Cheniere Sabine (2,600) Ocean Express (842) Tennessee (320) 21.6 BCF/D Total 3,612 Miles Pat Wood, III: Federal Energy Regulatory Commission
Certificated Since 6/1/2001 Storage Projects (Capacity in Bcf)June 2001 to March 2005 Wyckoff (6.0) Seneca (0.8) Dominion (5.6) KM (6.5) Saltville (5.8) Natural (10.0) Natural (10.7) SG Resources (12.0) Pine Prarie (24.0) Petal (8.0) Copiah (3.3) Gulf South (18.5) Pat Wood, III: Federal Energy Regulatory Commission
Existing and Approved North American LNG Terminals Constructed A. Everett, MA: 1.035 Bcfd (Tractebel - DOMAC) B. Cove Point, MD: 1.0 Bcfd (Dominion - Cove Point LNG) C. Elba Island, GA: 0.68 Bcfd (El Paso - Southern LNG) D. Lake Charles, LA : 1.0 Bcfd(Southern Union – Trunkline LNG) E. Gulf of Mexico: 0.5 Bcf/d (Gulf Gateway Energy Bridge – Excelerate Energy) Approved by FERC 1. Lake Charles, LA: 1.1 Bcfd (Southern Union – Trunkline LNG) 2. Hackberry, LA: 1.5 Bcfd, (Sempra Energy) 3. Bahamas: 0.84 Bcfd, (AES Ocean Express)* 4. Bahamas: 0.83 Bcfd, (Calypso Tractebel)* 5. Freeport, TX: 1.5 Bcfd, (Cheniere/Freeport LNG Dev.) 6. Sabine, LA: 2.6 Bcfd (Cheniere LNG) 7. Elba Island, GA: 0.54 Bcfd (El Paso - Southern LNG) Approved by MARAD/Coast Guard 8. Port Pelican: 1.6 Bcfd (Chevron Texaco) 9. Louisiana Offshore: 1.0 Bcfd (Gulf Landing – Shell) Mexican and Canadian Approved 10. St. John, NB: 1.0 Bcfd (Canaport – Irving Oil) 11. Point Tupper, NS: 1.0 Bcfd (Bear Head LNG – Anadarko) 12. Altamira, Tamulipas: 0.7 Bcfd (Shell/Total/Mitsui) 13. Baja California, MX: 1.0 Bcfd (Sempra & Shell) 11 10 A B C 7 13 6 D,1 2 3 4 5 9 8 E US Jurisdiction FERC US Coast Guard 12 As of March 25, 2005 * US pipeline approved; LNG terminal pending in Bahamas Pat Wood, III: Federal Energy Regulatory Commission
Existing Bulk Electric Transmission Grid Derived from Platts POWERmap Pat Wood, III: Federal Energy Regulatory Commission
New generation units added from June 1, 2001 to March 2, 2005 totals 185,908 MW Source: Derived from Platts POWERmap Pat Wood, III: Federal Energy Regulatory Commission
Transmission Projects 500 kV 345 kV 230 kV 10 Transmission Projects completedFebruary 2003 – March 2005(GTE 230kV & GTE 40 miles) Source: Derived from NERC ES&D database and Platts PowerMap Pat Wood, III: Federal Energy Regulatory Commission
Possible Transmission Projects Electric Transmission Needed to meet 2025 demand Pat Wood, III: Federal Energy Regulatory Commission
Impediments to new transmission include determining need, cost recovery and siting. • Need/Cost Recovery • It is difficult to determine need and cost allocation for new transmission lines • Lack of investment capital • Difficulty in securing long-term transmission rights • Regulatory uncertainty regarding regional transmission organizations in relations to infrastructure needs • Siting • Stakeholder concerns adversely affect the ability to successfully site and construct needed transmission lines, in a timely manner. • The lack of an effective forum/policy for coordinating or resolving multi-state disagreements on siting. Pat Wood, III: Federal Energy Regulatory Commission
Licensed and exempted hydropower projects provide 59 GW of electric generation capacity Pat Wood, III: Federal Energy Regulatory Commission
With a modest 2% growth in electricity demand, projected available generation capacity will be able to meet demand through 2020. Demand Projected Available Capacity Net additions included retirements and plants currently under construction and in advanced development. Source: Based on data from EEA January 2005, PLATTS PowerDat and NewGen. Pat Wood, III: Federal Energy Regulatory Commission
Removing impediments to hydro development • Timely and efficient licensing process as provided by the ILP • Congressional incentives • Renewable portfolio standards • Rational siting process • Encourage new technologies Pat Wood, III: Federal Energy Regulatory Commission
Existing major natural gas pipelines in U.S and Canada Source: Based on Platts PowerMap Pat Wood, III: Federal Energy Regulatory Commission
Existing natural gas storage and LNG facilities Source: Based on Platts PowerMap Pat Wood, III: Federal Energy Regulatory Commission
Impediments to new LNG terminals and natural gas pipeline and storage facilities • Safety/Security concerns • Take away capacity • Local acceptance • Redundant federal and state approval Pat Wood, III: Federal Energy Regulatory Commission
Conclusions • Challenges lie ahead • Coordination of integrated national energy infrastructure planning • Authority to ensure that projects in the national interest are constructed in a timely manner • Jurisdiction over bulk electric transmission used in interstate commerce. • Rational Siting Process Pat Wood, III: Federal Energy Regulatory Commission