Download
1 / 34
350 likes | 593 Views
Covariance. And portfolio variance. The states of nature model. Time zero is now. Time one is the future. At time one the possible states of the world are s = 1,2,…,S. Mutually exclusive, collectively exhaustive states. This IS the population. No sampling. The states of nature model.

E N D
Covariance And portfolio variance
The states of nature model • Time zero is now. • Time one is the future. • At time one the possible states of the world are s = 1,2,…,S. • Mutually exclusive, collectively exhaustive states. • This IS the population. No sampling.
The states of nature model • States s = 1,2,…,S. • Probabilities ps • Asset j • Payoffs Rj,s • Expected rate of return
= rate of return on j in state s = probability of state s = expectation of rate on j
Variance and standard deviation • Form deviations • Take their expectation.
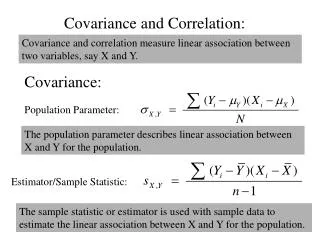
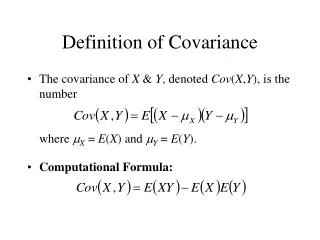
Covariance • Form the product of the deviations • (positive if they both go in the same direction) • and take the expectation of that.
Covariance • It measures the tendency of two assets to move together. • Variance is a special case -- the two assets are the same. • Variance = expectation of the square of the deviation of one asset. • Covariance = expectation of the product of the deviations of two assets.
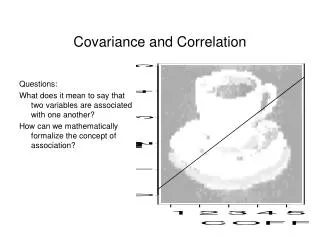
Correlation coefficient • Like covariance, it measures the tendency of two assets to move together. • It is scaled between -1 and +1.
Correlation coefficient • = covariance divided by the product of the standard deviations. • Size of deviations is lost.
Intuition from correlation coefficients • = 1, always move the same way and in proportion. • = -1, always move in opposite directions and in proportion. • = 0, no tendency either way.
Portfolio Risk and Return • Portfolio weights x and 1-x on assets A and B.
An amazing fact • Mixing a risky asset with a safe asset • is often safer than the safe asset.
Variance of portfolio return • Diversification effects
Portfolio deviation Deviation squared Remember
Portfolio variance depends on covariance of the assets. Positive covariance raises the variance of the portfolio.
Historical data • Holding period return • Equivalent annual return • Not the same
Holding period return1926-1929 • Rhp is the holding period return • 1+Rhp = (1+r26)(1+r27)(1+r28)(1+r29) • = 1.1162*1.3749*1.4362*.9158 • = 2.0183592 • Rhp = 101.83592%.
Question: • Is Rhp the return from holding 4 years at the sample average rate? • No. • 4 years at 21.075% would yield (1.21075)^4-1 =1.1489084 • i.e. 114.89 %, instead of Rhp = 101.83592%
Review question • Define the internal rate of return.
Answer: • The internal rate of return of a project is r such that, given the cash flows CFt of the project,
Review item • In the first year a portfolio has a rate of return of -30%. • In the second year it has a rate of return of +30%. • What is the holding period return?
Answer: • Solve 1+Rhp=(.7)(1.3). • Then Rhp = .91 - 1 = -.09.
Equivalent annual rate is the geometric average • Solve for x in (1+x)^4 =2.0183592 • Solution 19.19269%. • approximately. • It answers the question: what is the equivalent rate over 4 years? • Population mean answers the question: • What is the average for next year?