Download
1 / 28
290 likes | 603 Views
Soil fertility considerations in direct seeding . Rich Koenig, Associate Scientist/Extension Soil Fertility Specialist. Discussion Topics. Soil changes as a result of direct seeding (compared to conventional tillage) Implications of these changes on nutrient management Nitrogen mineralization

E N D
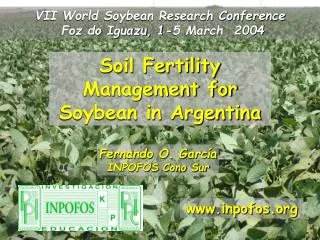
Soil fertility considerations in direct seeding Rich Koenig, Associate Scientist/Extension Soil Fertility Specialist
Discussion Topics • Soil changes as a result of direct seeding (compared to conventional tillage) • Implications of these changes on nutrient management • Nitrogen mineralization • Cold, wet soils and nutrient placement • Enhanced immobilization and volatilization potential • Other • Other topics and recent research results, as time permits • Chloride • Phosphorus • Split nitrogen applications • Nitrogen management for wheat
Physical changes • Improved aggregation (formation of clods) • Increased density (compaction) in soils prone to this problem (fine textures) • Reports of short term increase in compaction problem • Aggregates eventually become more stable and compaction problem eases • Improved water infiltration and percolation • Reduced runoff, erosion, etc.
Physical changes • Stratification of residue • Layering on the surface vs. incorporation • Higher soil moisture, particularly at the surface • Lower soil temperature due to the insulating effect of residue and higher moisture • Lower oxygen concentration at the surface • Collectively, cool, wet soils limit biological and root activity, and nutrient uptake by plants
Biological changes • Overall higher microbial biomass (more/larger organisms out there) • Different groups of microbes • Increase in fungi biomass compared to bacteria • Mycorrhizae fungi and associated benefits on nutrient uptake • Perhaps a lower level of microbial activity • Slower and different metabolism • Physical effects – residue not in contact with soil • Different location of microbes and activity (in residue layer rather than in the mineral soil)
Biological changes • Lower nitrogen mineralization rates per unit of organic matter (remember: biological process) • Lower surface temperature • High moisture and lower oxygen levels • Crop residues not in contact with the soil and not physically broken down by tillage • Potential for immobilization and volatilization with broadcast nitrogen • Root growth and nutrient availability issues with lower temperatures
Chemical changes • Short term - lower mineralization contributions to the total N supply • Eventually, an overall higher level of organic matter leading to greater mineralization contributions to the total N supply • Nutrient and pH “stratification”or layering • Phosphorus, potassium, other immobile nutrients • Many unknowns here
Stratification of acidity under direct seeding 6 inches No treatment 6 inches Broadcast lime
Aside: how fast are changes reversed in a return to tillage? • Immediately for soil temperature and moisture conditions • As little as 2 months to completely reverse soil aggregation and other physical improvements • Immediate increases in nitrogen mineralization, carbon dioxide evolution and perhaps nitrous oxide emissions
Nitrogen mineralization • Issue #1 • Initial conversion to direct seeding results in the accumulation of organic matter with a required accumulation of organic nitrogen • Consider this: • 1% organic matter in 1 foot of soil • = ~40,000 lb organic matter/acre • = ~15,000 lb organic carbon/acre • = ~1,500 lb organic nitrogen/acre • Transition period varies with environment and cropping system (5-10+ years commonly quoted)
Nitrogen mineralization • Issue #2 • Rates of organic matter mineralization are lower due to cooler and wetter (lower oxygen) soil conditions • Research • No-till mineralization rates were 44% of conventional till rates in a Missouri corn rotation • No-till mineralization rates were 52% of conventional till rates in canola residue from Canada • 3.4x higher rates of mineralization with conventional compared to no till in Georgia with sourghum • Larger differences in residue of cereals than legumes
Nitrogen mineralization • How to deal with this? • Options during the transition to direct seeding • Don’t take the mineralization credit • Don’t include surface organic residues in soil samples • Use a lower N mineralization estimate • 10 to 15 lb N for each % organic matter up to 3% (compare to 20 lb N for each % in conventional till) • Factor in immobilization
Nitrogen mineralization • After the transition to direct seeding • Monitor soil organic matter levels (now need to include surface residues) • Look for stable numbers over time = completed the transition • Continue to use lower factor for N mineralization per % organic matter
Colder and wetter soils • Reduced root growth and efficiency of nutrient uptake, especially in spring • Mycorrhizae may partially offset this effect • Emphasize the importance of subsurface banding of phosphorus and nitrogen • Emphasize the importance of starter fertilizers placed with or near the seed, especially for spring crops
Immobilization and volatilization potential • Limited to surface broadcast applications of nitrogen for immobilization and urea-based forms for volatilization • Subsurface banding to place nitrogen below residue limit immobilization • Broadcasting nitrgoen when temperatures are low and precipitation is imminent to limit volatilization
Direct seed fertility recommendations emphasize • Importance of soil testing • Difficulty in estimating nitrogen mineralization during the transition and later • Importance of subsurface placement of nitrogen and immobile nutrients • Importance of starter fertilizers • Some unknowns
2004-05 and 2005-06 Winter Wheat Chloride Studies • Comprehensive study • 2 locations: Pullman and Farmington (soil test chloride 18-19 lb/ac in top 2 feet) • 2 sources: ammonium chloride and potassium chloride • 2 application times: fall (deep band) and spring at herbicide treatment • 2 rates: 0 and 30 lb chloride/acre • 5 varieties: Falcon, Finch, Madsen, ORCF 101, Tubbs
Average chloride source-rate effects No statistical difference * *Significantly different from +Cl treatments
Average yield response - all site-years +9 +11 +11 Average response (bu/ac) +11 0
Madsen – no chloride With chloride Finch – no chloride With chloride
Flag leaf spots - 2005 Pullman study *stripe rust