Download
1 / 23
230 likes | 364 Views
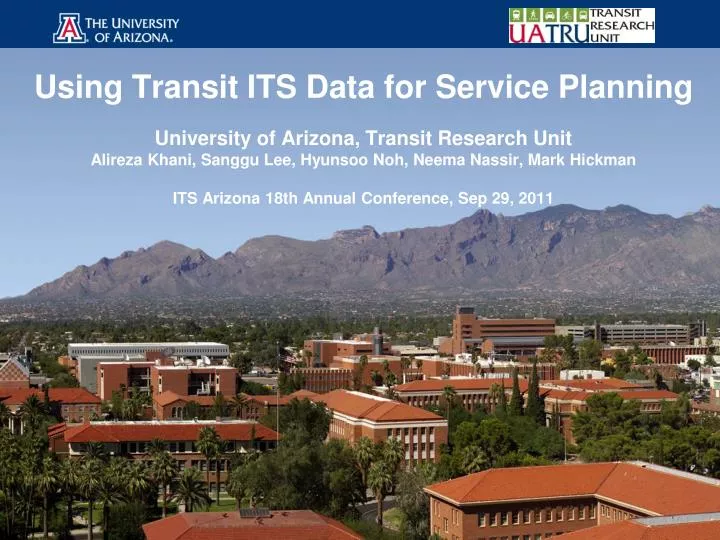
Using Transit ITS Data for Service Planning. University of Arizona, Transit Research Unit Alireza Khani, Sanggu Lee, Hyunsoo Noh, Neema Nassir, Mark Hickman ITS Arizona 18th Annual Conference, Sep 29, 2011. Outline. Introduction / Motivations Data Data Analysis Applications.

E N D
Using Transit ITS Data for Service Planning University of Arizona, Transit Research Unit Alireza Khani, Sanggu Lee, Hyunsoo Noh, Neema Nassir, Mark Hickman ITS Arizona 18th Annual Conference, Sep 29, 2011
Outline • Introduction / Motivations • Data • Data Analysis • Applications
Introduction / Motivation • How to transform the massive data into useful information and support decision-making • From fare card data, • how to identify boarding stops • how to infer alighting stops (known boarding) • how to estimate travel/alighting time • how to analyze travel pattern/behavior • From Google’s transit data, • how to utilize a transit network • how to develop an intermodal network • how to find the shortest/optimal path
Automated Data Collection System Data • Metro Transit (www.metrotransit.org) data • Serving Minneapolis/St. Paul area, MN • November 2008 (30 days) • Entry-only-control operation • Implemented independently
Google’s Transit Data • General Transit Feed Specification (GTFS) • Open to public and frequently updated by agencies • Stops, routes, trips, stop_times (schedules) • Metro Transit in 2008 • Routes.txt: 220 • Stops.txt: 14,601 • Trips.txt: 25,417 • Stop_times.txt: 1,471,150
APC with LOCATION VEHICLE ID ROUTE NO AFC TRAVELER VEHICLE STOP ID DATE / TIME SEQUENCE ROUTE NO SCHEDULE USE TYPE SCHEDULE VEHICLE ID LOCATION STOP TIMES STOPS ROUTES TRIPS CALENDAR TRIP ID STOP ID ROUTE ID TRIP ID SERVICE ID STOP LOCATION ROUTE NO ARRIVAL TIME DEPARTURE TIME STOP CITY DESCRIPTION STOP ID SEQUENCE GENERAL TRANSIT FEED SPECIFICATION (GOOGLE) Relational Schema Automated Data Collection System (ADCS) Presented at 90th TRB Annual Meeting in Washington, DC on January 2011
USER Purchases SPECIAL SERIAL NO CARD TYPE METRO PASS U-PASS C-PASS FARE CARD STORED VALUE Requests TRANSACTION 1 TRANSACTION 2 TRANSACTION 3 TRANSACTION 4 DATE / TIME DATE / TIME DATE / TIME DATE / TIME ROUTE NUMBER ROUTE NUMBER ROUTE NUMBER ROUTE NUMBER USE TYPE USE TYPE USE TYPE USE TYPE BUS ID BUS ID BUS ID BUS ID LOCATION LOCATION LOCATION LOCATION DURATION 1 DURATION 2 DURATION 3 Access Time Waiting Time In-Vehicle Time Egress Time Transfer Time Activity Time Data Analysis Presented at 90th TRB Annual Meeting in Washington, DC on January 2011
Data Analysis – cont. Between-day Hourly Variation in Transactions by Card Type Duration Distribution by Card Type Presented at 90th TRB Annual Meeting in Washington, DC on January 2011
Application 1 Transit O-D Estimation Using Fare Card • Objective: To find the origin, destination, and transfer stops of each passenger in Minneapolis/St. Paul transit system Shopping Work Home Transfer Bus Walk Transaction Bus Stop Presented at 90th TRB Annual Meeting in Washington, DC on January 2011
Application 1 Transit O-D Estimation – cont. • This model • Finds the boarding and alighting stop for each AFC transaction, as well as the possible trip taken by the passenger • Infers the transfers made by passenger by looking at the boarding and alighting times, service headway, etc • Verifies the results by comparing with APC sample data • Results for a typical weekday • 90,154 transactions in AFC data set • 84,413 transaction after refining the data set • 33,514 transactions with estimated OD (28,260 persons) • 98% percent verified by APC sample data Presented at 90th TRB Annual Meeting in Washington, DC on January 2011
Application 1 Transit O-D Estimation – cont. AM Mid-day PM Origin Destination Presented at 90th TRB Annual Meeting in Washington, DC on January 2011
Application 2 Transit Path Choice Model Using Fare Card • Objective: To calibrate a logit model for transit path choice using the results of the O-D estimation study (Minneapolis/St. Paul) Destination Destination Destination Origin Origin Origin Choice set Passenger 1 Passenger 2 Presented at 13th TRB National Planning Applications Conference in Reno, NV on May 2011
Application 2 Transit Path Choice Model – cont. Presented at 13th TRB National Planning Applications Conference in Reno, NV on May 2011
Application 2 Transit Path Choice Model – cont. • Calibration Tools • Easy Logit Modeler (ELM) (http://www.elm-works.com) • Biogeme (http://biogeme.epfl.ch) • Results Presented at 13th TRB National Planning Applications Conference in Reno, NV on May 2011
Transit Path Algorithms Using GTFS Data • Objective: To develop efficient algorithm for transit and intermodal shortest/optimal path • Trip-Based Shortest Path (TBSP) • Shortest path algorithm utilizing hierarchical transit network • Intermodal Optimal Path (IOP) • Optimal path with combined modes (auto and transit) • Intermodal Optimal Tour (IOT) • Optimal path for a tour with multiple destinations with combined modes • Link-Based Transit Hyperpath • Optimal strategy for schedule-based transit systems
Application 3 Trip-Based Shortest Path (TBSP) • The idea • Using trips as the elements of the network (instead of links) • Distinguish between transfer stops and non-transfer stops in the labeling algorithm • Performance in computation
Destination Origin Application 4 Intermodal Optimal Path (IOP) • This model • Using TBSP for the transit side • Using a multi-source time-dependent shortest path for the auto side • Modeling Park-and-Ride locations to make the connections • Contributions • Solve for the optimal intermodal path and transfer point between an origin and a destination for a preferred arrival time • The complexity is the same as single-mode path (e.g. TBSP)
Application 5 Intermodal Optimal Tour (IOT) D3 D2 D32 D22 • Objective • Capture the effect of back trip on park-and-ride choice • Find optimal tour and optimal park-and-ride facilities for a sequence of activities P22 D12 D1 P2 D21 D31 P1 D11 P11 Origin D30 D20 D10 P20 P10 Origin
Application 6 Link-Based Transit Hyperpath • Objective: To search an optimal strategy path on a transit schedule network using logit model • Link-Based Time-Expanded Network • A run (or trip) segment between two consecutive stops is considered a unique link • Search Model e1 [cost, departure time] [25, 7] e6 e5 [6, 19] [6, 8] e10 [4, 15] e2 e7 [7, 1] [6, 28] es et e11 [4, 21] A B C D e3 [8, 5] e8 [4, 11] e12 [10, 13] e13 e9 [5, 16] [10, 23] e4 [7, 10] e14 [10, 43] Route 3 Route 1 Route 4 Route 2
Application 7 Transit Assignment and Simulation • Integration among transportation models • Activity-Based Model (ABM) for demand • Dynamic Traffic Assignment (DTA) model FAST-TrIPs Passenger assignment and simulation on GTFS Transit Assignment and Simulation ABM DaySimOpenAMOS DynusT MALTA Vehicle assignment and simulation DTA Presented at 13th TRB National Planning Applications Conference in Reno, NV on May 2011
Application 7 Transit Assignment and Simulation – cont. • Contributions • Capability to model travel behaviors according to Google’s GTFS which allows to connect to DTA model, such as boarding and alighting • As well as integrating between ABM and DTA, the schedule-based transit assignment and simulation supports the intermodal capability • Funded by FHWA EAR program and SHRP2 C-10B
Thank you!! • University of Arizona, Transit Research Unit